Data analysis tools & spreadsheets
The following is a brief selection of some of the Excel spreadsheets I have built and use within my business. Please note that as spreadsheets have been designed on a Macintosh operating system there may be some formatting issues if opening/viewing on a PC (or device without Microsoft Excel).
|
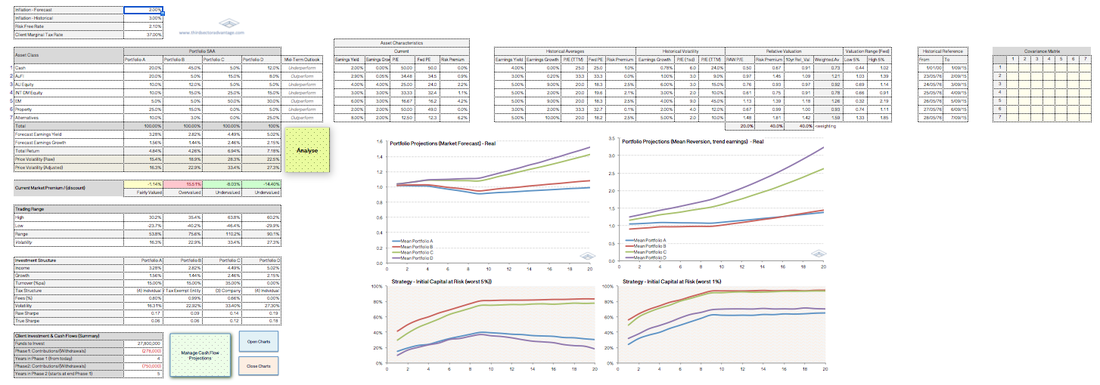
Monte Carlo Simulation - Portfolio modelling
|
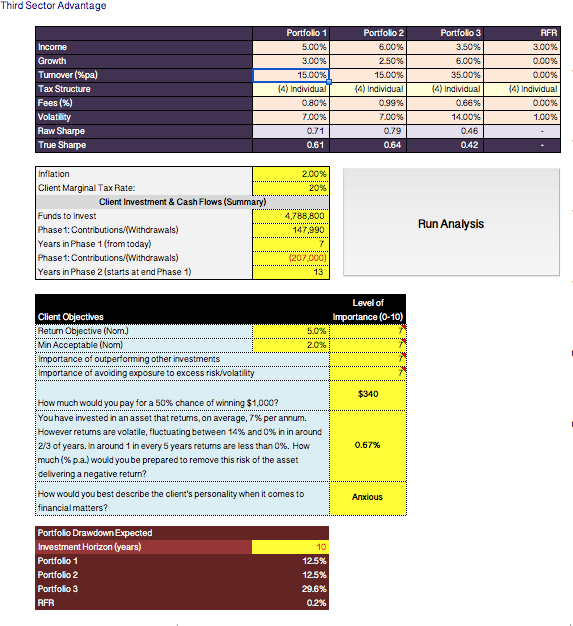
This Monte Carlo simulator provides comparison of three portfolios (plus Risk Free Rate), with ability to incorporate the impact of tax, fees, composition of returns, portfolio turnover, return objectives and inflation.
Importantly the simulation allows us to take into account the client's cash flows (contributions/withdrawals). This allows the user to consider how a static portfolio (i.e, constant Strategic Asset Allocation) might be expected to perform. Analysis includes the following:
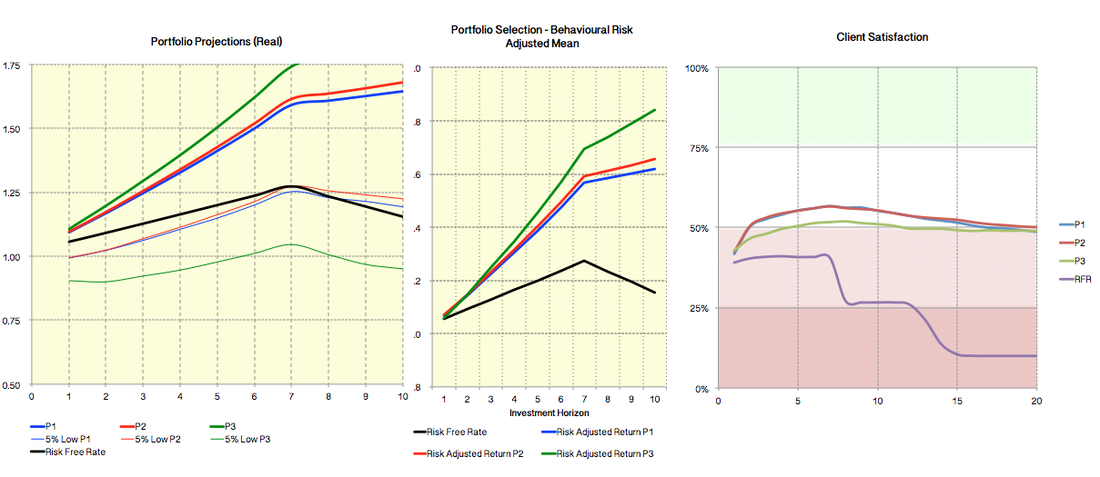
Incorporated in the analysis are several qualitative factors, such as the client's personality and importance of reaching certain goals. This includes two questions to assess the client's attitude toward statistically measurable risks that tend to elicit emotional rather than rational responses (gambling question and insurance question). In this simulator we make the assumption that the client is on a spectrum of loss aversion; thus, we focus on both the probability and consequence (severity and client's aversion to risk) from failure of each measure. This flows through to two charts: "Portfolio Selection - Behavioural Risk Adjusted Mean", and "Client Satisfaction". As it stands today, I do not use these qualitative aspects to determine a client's portfolio. Rather this was an exercise in thinking about how client questionnaires and risk profiles may be better administered to clients (this is perhaps a job for a psychometrician to develop further?).
| ||
|
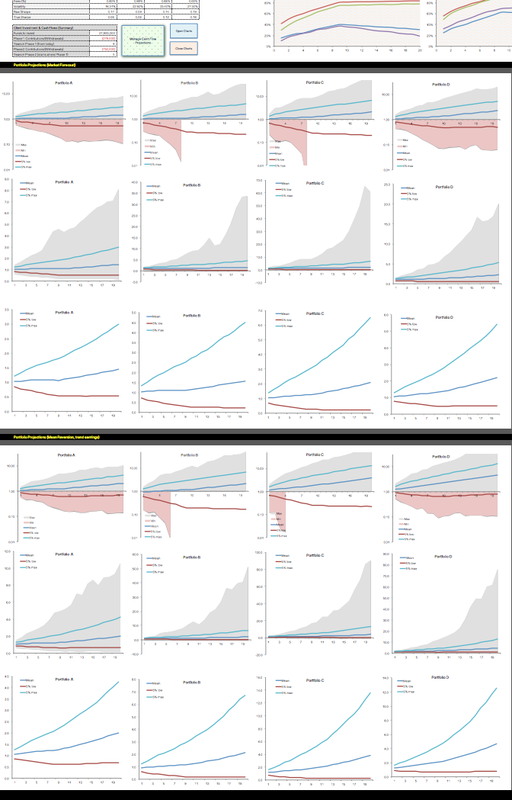
Monte Carlo Simulation: Predictions in uncertain markets
|
One of the greatest challenges any investment advisor must face is building investment portfolios when, at a given moment in time, market and asset analysis provide conflicting views as to an asset's suitability.
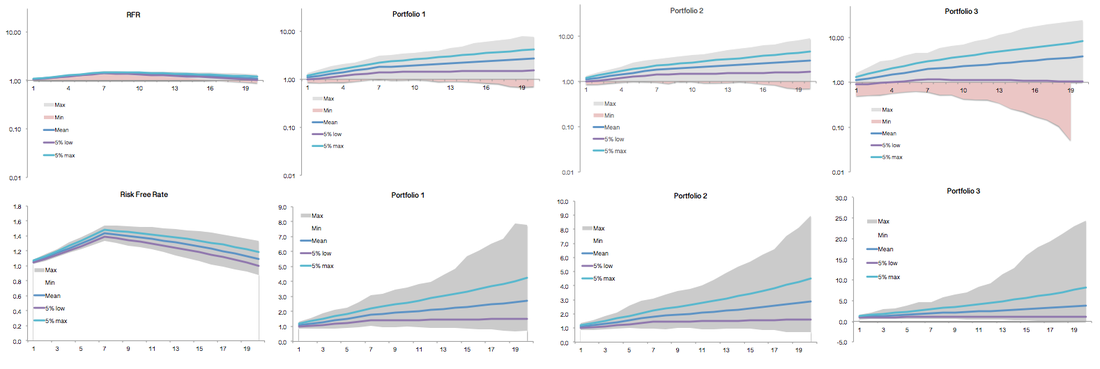
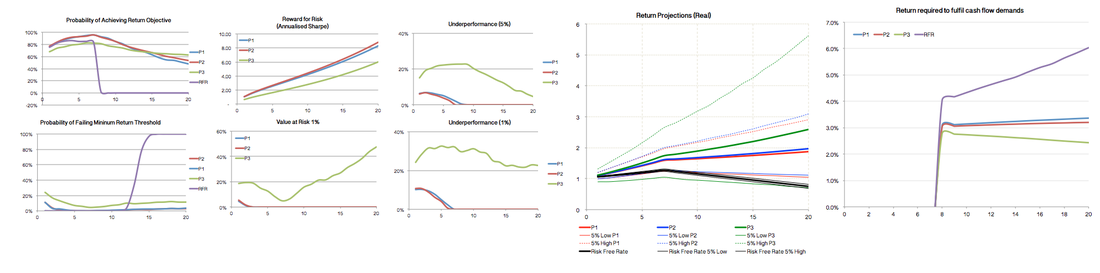
For example, while one set of data may suggest US equities are moderately overvalued, another may argue that the price is justified due to a low interest rate environment or strong near-term earnings growth. This simulator attempts to illustrate both the problems and opportunities this can create. Broken down to it's most basic level, if we can agree that over the very long term an investor's return (expressed as CAGR) should reflect the rate of real (inflation adjusted) earnings growth less tax and fees, then we also be able to agree that most volatility is due to investors (subjective) pricing of those earnings. If this assumption is right, then over the very long term (multiple decades) the return an investor can expect should be calculated on long-term real earnings growth and volatility on the value of their investment re-based / adjusted to reflect current market anomalies (i.e., where asset prices are under/over valued). Of course undertaking this type of analysis will inevitably cause inaccurate short-term forecasts, but over the long term it can offer valuable insights by estimating the return from assets on both a historical (investment capital adjusted) basis, as well as based on shorter-term market forecasts. This enables us to determine whether an asset that may currently look very expensive is, in fact, a better investment proposition than an asset that looks very cheap but still offers a lousy return. This simulator uses three measures of relative value (forward P/E, Risk Premium and 10-Year compound return) with the user able to adjust the settings to suit their own opinion of relevance. Of course we could complete this analysis using some fairly basic maths, but it would be challenging to make sense of how this might interact with an investor's cash flows. This simulator simplifies this process and allows the user to manipulate data to ensure a more thorough analysis of portfolio outcomes. This spreadsheet runs a series of Monte Carlo simulations, separating the four portfolios into eight different accounts, each of which run 10,000 independent trials over 20 time periods* while incorporating the client's cash flow requirements/contributions. Volatility and returns are modelled on an after-tax basis. Although time periods are based on one-year, this can be adjusted by changing return and volatility expectations (ie., returns = r^(n), volatility = vol*(sqrt(n)) ). Please contact me for a copy. |
|
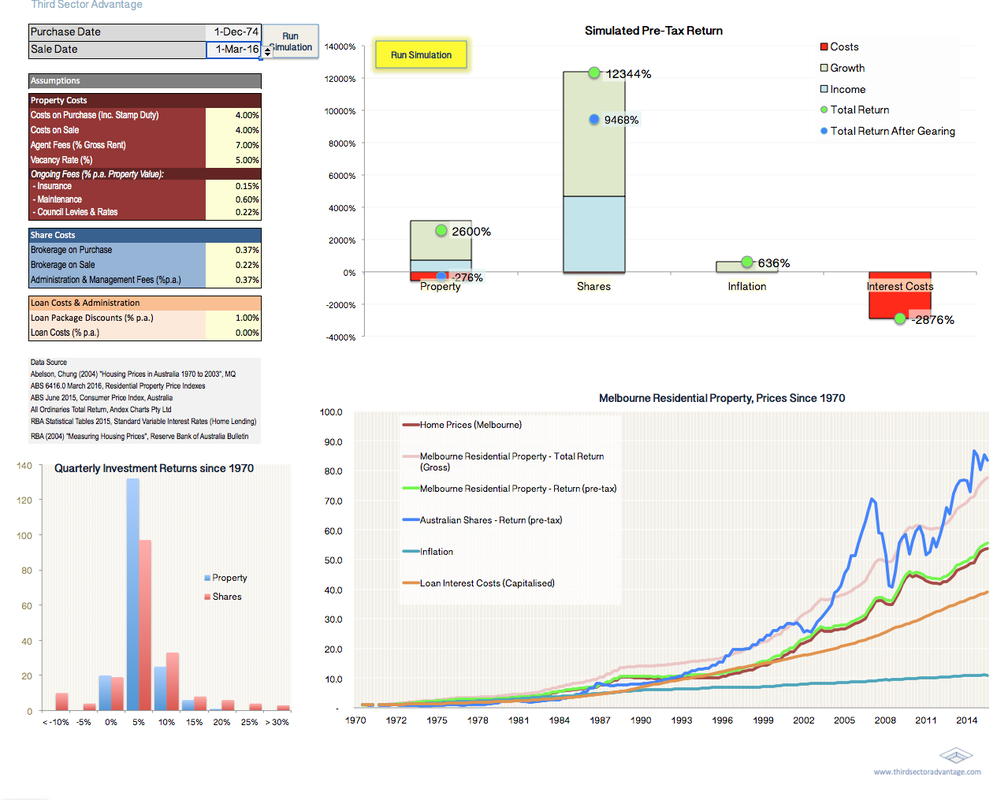
Property vs Shares (Simulator)
|
Despite roughly 40% of Australians' private wealth being tied up in residential property (predominantly the family home) it is quite incredible that most investors and advisers alike have a somewhat distorted and over-romantisiced view of property as an investment class.
Of course this is not entirely unexpected. Not only because of the tendency for investors to treat anecdotal and empirical evidence as equals, but because the other key source of information tends to be from real estate agents, "advertorials" and industry associations. The objective of this simulator is to not only help clients gain a better understanding of property, but also to help other advisers illustrate to their clients the inherent risks and costs associated with property investment.
| ||
|
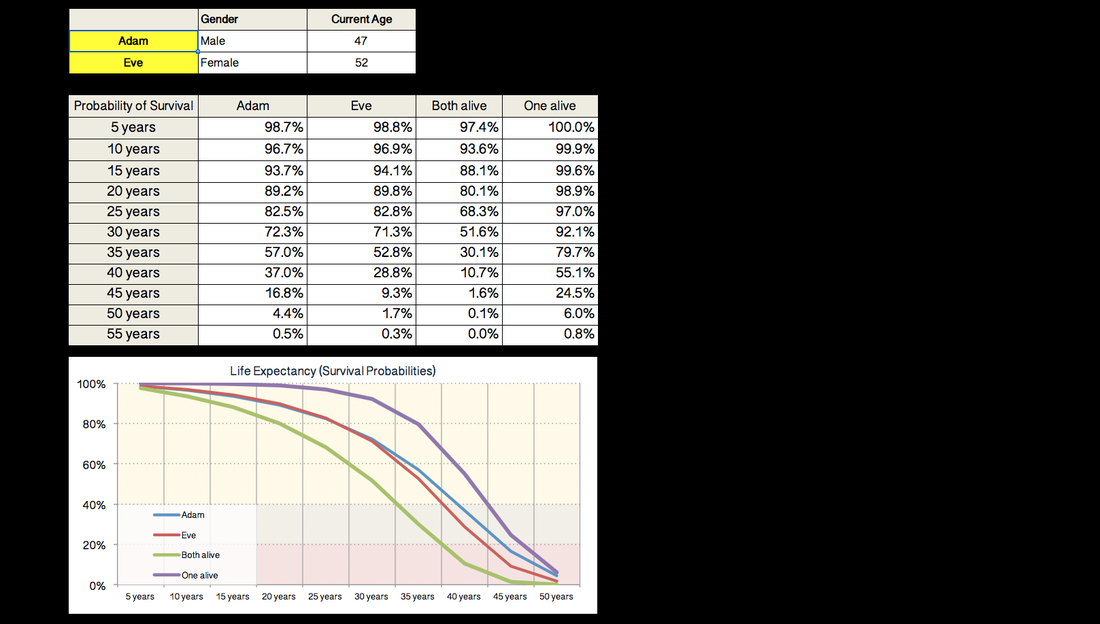
Life Expectancy Calculator
|
Based on Australian Life Tables (2014), this simple life expectancy calculator is designed to help with client discussions around issues such as capital adequacy and the risks of outliving their retirement savings.
| ||
|
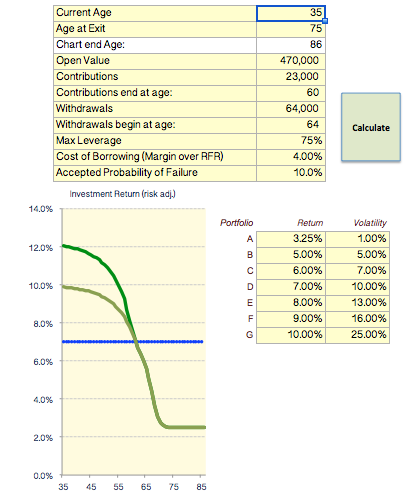
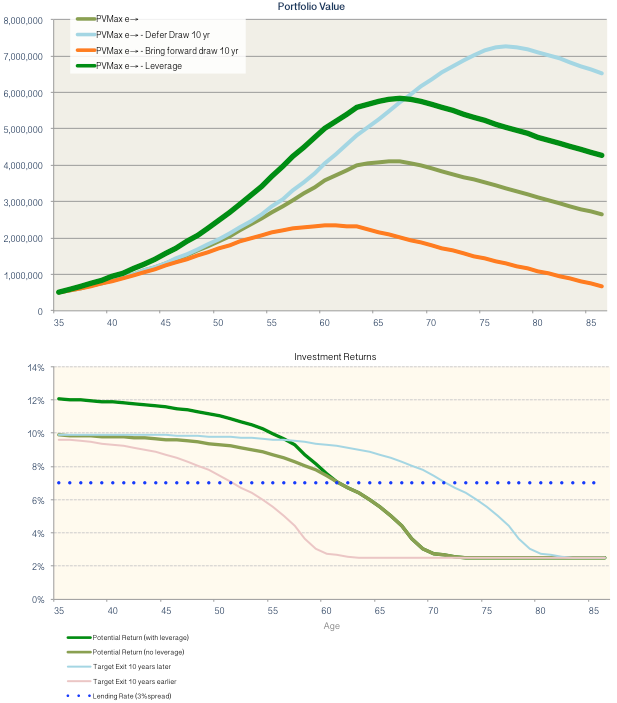
Volatility-adjusted returns: adjusting for time, cash flows and leverage
|
For many people the idea of "losing money" - even if only a temporary "paper loss" - is uncomfortable. For some investors it becomes their sole focus, while many advisers seem confident quoting Warren Buffet's "two rules of investing" without understanding context.
This has the effect of reinforcing the misconception that volatility and risk are the same thing. In this environment t's not surprisingly we see many investors continue to make irrational decisions; for example people who on the day of their retirement move all their money to cash. This spreadsheet seeks to provide a simple illustration of how an investor should allocate their capital over their stated investment horizon, while factoring in their comfort level with debt. To do this each portfolio is modelled independently with their returns over time discounted to volatility in order to reflect (with the stated confidence level) the minimum level of return the portfolio would be expected to achieve. This incorporates the client's cash flows. By laying each of these "risk adjusted" portfolios side-by-side we can determine which one provides the best risk-adjusted return. This is assumed to be the most appropriate asset for the client to select. Also illustrated is the expected return and portfolio value if the client's "exit" date were pushed back 10 years or brought forward 10 years. Importantly, "exit" date is just meant to infer an arbitrary "investment horizon" used by clients. For example, let's say the aforementioned recent retiree is 65 years of age and uncomfortable investing beyond 5 years, even though he is in good health and expected to live into his nineties.
| ||
|
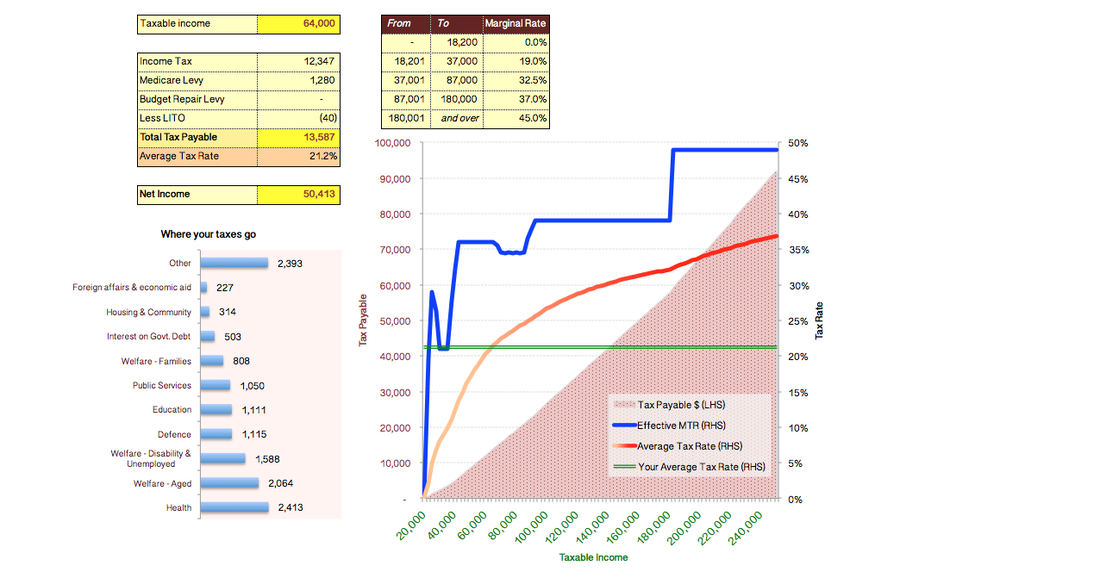
Income Tax Calculator
|
A quick and easy Income Tax calculator (based on tax rates announced in the 2016 Federal Budget).
| ||