Market Update
Well, what a difference six months can make. Back in July our primary focus was on the winding-back of global "Quantitative Easing" (Bond buy-backs and money printing) as US economic growth accelerates to more self-sufficient levels, while at home in Australia our mid-term predictions pointed toward a struggle in coping with an impending crash in our Terms of Trade. The combination of these factors, we argued, pointed to a sharply lower dollar and relative underperformance of Australian equities (pretty common-sense stuff, if you think about it).
|
Whether it's random chance or foresight, or a bit of both, today we see that most of these predictions have become reality (though September quarter's massive 3.5% drop in Terms of Trade - bringing it to 8.9% YoY - and the US halting QE are probably a bit more extreme that we would have liked).
For investors who took the underweight Australian equities and overweight unhedged North American equities the result has been pretty good. A return of around 20% from North American versus 0% from Australia. The weakening Aussie dollar was a key contributor to these results. Of course taking some of the shine off these returns was our high allocation to cash and fixed income assets. I can assure investors that as an investment vehicle over the long term we don't like cash either as it almost guarantees that the value of your capital isn't keeping up with inflation, however more dangerous than not investing aggressively enough is investing too aggressively. |
|
Market Outlook
With that we turn to our outlook for the year ahead. Whereas the story of the year in 2014 was Government policy and stimulation ($trillion and counting!), it's looking more and more likely that 2015 will be dominated by one thing: oil!
A combination of over-enthusiastic investment and production by North America and an aggressive attempt by OPEC to protect their market share has resulted in oil prices crashing by more than 50% (see chart: "Daily US Light Crude" - that's what has happened since 1 July!).
Ouch!! This caught us (and, to be fair, everyone else with the exception perhaps of some OPEC puppeteers) completely off-guard. But if you can look past the $1 trillion loss in oil revenues that is captured within that chart, there is an upside. If you missed my previous market update on the "supply glut" (including some predictions that have already been proved wrong!) you can find it here, however I will be releasing a second report on the economics of oil in the coming weeks.
Energy markets aside, the other key theme we expect to see develop is an acceleration in the flight of capital from Australia towards the US as investors cautiously downgrade Australia's economic outlook. As I've spoken about at length on many occasions, the underlying drivers of this are small but potentially significant fractures in our economy (in particular our Terms of Trade, wages, consumer debt and residential property).
In relative terms, from an economic growth perspective we expect to see the US continue to outperform other regions of North America and Europe, though there is a fairly high chance that in the absence of further stimulus we could see a quarter (or two) of very weak (and possibly even negative) growth.
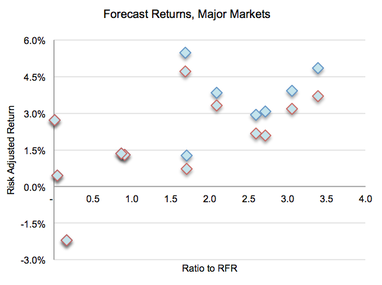
From an investment perspective it's a little harder to call. The US (both S&P500 and Nasdaq) both appear somewhat overvalued, but then so does just about every other developed market. The chart opposite (Forecast Returns, Major Markets) plots the risk-adjusted return of the markets we follow. Sure, there are two or three markets that appear to offer a risk premium of 4.5% or so, but given the overwhelming economic uncertainty and unwinding of stimulus is this really enough to compensate investors for the risk?
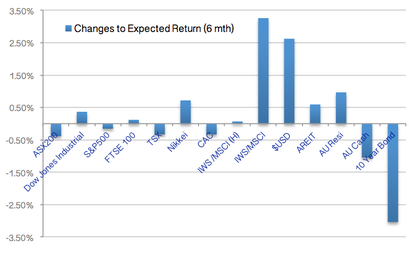
It's worth noting that in light of the recent collapse in oil prices, UK QE, and a further reduction in China's growth targets we have been progressively adjusting our earnings growth, inflation and interest rate forecasts to better model expected equity returns. Compared against our 3 year earnings forecasts (CAGR) set in July 2014 we have seen a decline in forecast returns from every key market segment other than US industrial stocks, the Nikkei and Australian REIT and residential property (though the net return forecast for residential property is still negative). The one stand-out performer is the $USD, with our 1 year forecast for the $AUD/USD dropping to $0.7512, reflecting an increase of 0.15% in the interest rate differential (due to interest rate changes and/or expansion in risk premium). A summary of these changes is provided below (chart: "Changes to Expected Return (6 mth)"). Note that only a very small part of these change to return outlook have to do with performance of the underlying assets; in general returns over the past six months were jumpy, but with the exception of the $USD ended the 6 months quite flat.
For many of our investors this has prompted a few adjustments to portfolio allocations, most notably a slight reduction in US and Australian equities and the $AUD. Replacing these assets has proved to be an ongoing challenge in recent times as local markets shift toward the "lower for longer" interest rate paradigm and quality Kanga Bonds become more elusive and expensive. Dependent on the investment structure many investors could do worse than consider some of the higher interest bearing cash accounts (our current Interest Rate Card - at the time of writing - is available here).
In relative terms, from an economic growth perspective we expect to see the US continue to outperform other regions of North America and Europe, though there is a fairly high chance that in the absence of further stimulus we could see a quarter (or two) of very weak (and possibly even negative) growth.
From an investment perspective it's a little harder to call. The US (both S&P500 and Nasdaq) both appear somewhat overvalued, but then so does just about every other developed market. The chart opposite (Forecast Returns, Major Markets) plots the risk-adjusted return of the markets we follow. Sure, there are two or three markets that appear to offer a risk premium of 4.5% or so, but given the overwhelming economic uncertainty and unwinding of stimulus is this really enough to compensate investors for the risk?
It's worth noting that in light of the recent collapse in oil prices, UK QE, and a further reduction in China's growth targets we have been progressively adjusting our earnings growth, inflation and interest rate forecasts to better model expected equity returns. Compared against our 3 year earnings forecasts (CAGR) set in July 2014 we have seen a decline in forecast returns from every key market segment other than US industrial stocks, the Nikkei and Australian REIT and residential property (though the net return forecast for residential property is still negative). The one stand-out performer is the $USD, with our 1 year forecast for the $AUD/USD dropping to $0.7512, reflecting an increase of 0.15% in the interest rate differential (due to interest rate changes and/or expansion in risk premium). A summary of these changes is provided below (chart: "Changes to Expected Return (6 mth)"). Note that only a very small part of these change to return outlook have to do with performance of the underlying assets; in general returns over the past six months were jumpy, but with the exception of the $USD ended the 6 months quite flat.
For many of our investors this has prompted a few adjustments to portfolio allocations, most notably a slight reduction in US and Australian equities and the $AUD. Replacing these assets has proved to be an ongoing challenge in recent times as local markets shift toward the "lower for longer" interest rate paradigm and quality Kanga Bonds become more elusive and expensive. Dependent on the investment structure many investors could do worse than consider some of the higher interest bearing cash accounts (our current Interest Rate Card - at the time of writing - is available here).
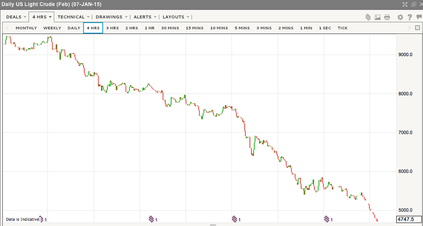
US Light Crude - Spot price since 1 July 2014
|
|
Disclaimer: Not to be interpreted as personal advice. For more information, or to discuss how this relates to you, please consult your adviser.
*As someone who spends a substantial part of their day valuing assets, I can't emphasis enough how precarious Australia's residential market has become, built upon the fallacy that prices can (and will) continue to grow at a rate significantly faster than inflation, and with very little risk. As I've written about many times before, there are firm economic and mathematical reasons why these mythical believes are not only flawed, but ultimately doomed to failure.
*As someone who spends a substantial part of their day valuing assets, I can't emphasis enough how precarious Australia's residential market has become, built upon the fallacy that prices can (and will) continue to grow at a rate significantly faster than inflation, and with very little risk. As I've written about many times before, there are firm economic and mathematical reasons why these mythical believes are not only flawed, but ultimately doomed to failure.