Market Note: 19 December 2014 12:39 pm
Oil Glut
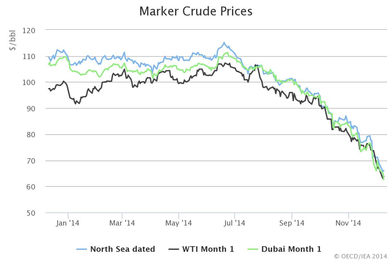
It's 19 December 2014 and front-month spot prices Brent Crude are selling for $59.27 per barrel (AUD$71.66).
It's a result that 6 months ago would have horrified (or excited) every analyst and oil producer, and signals it's lowest price since we first stepped off the cliff into the "Global Financial Crisis".
Of course today's decline is very different to 2008. Back then the reasons were relatively one-dimensional: We were spiralling out of control into an economic abyss. The oil price - which, like just about every other tradable commodity had risen by well over 100% in the previous two years - suddenly fell from $147 to less than $60/bbl. Today, on the other hand, if feels as if we are getting hit from (almost) all sides.
…And you thought 2008 was bad?
Like in 2008, today the outlook for oil demand is down. There are a combination of factors here. Efficiency gains in major developed markets (US in particular), a relative slow-down in the industrialisation of China (who, let's not forget, is on par with the USA as largest net importer of oil), and the adverse affect of oil prices on the Russian economy and consumption (a sort of self-fulfilling loop). All up the slow-down is expected to reduce demand relative to previous growth forecasts by around 0.7 - 1.5 million barrels per day (mbbl/d).
Next we are getting hit with supply. While much of the media seems convinced that excess production was conspired by OPEC (Organisation of Petroleum Exporting Countries), the real source of this supply "glut" is due to the massive expansion in oil exploration and production since the late 90s (in response to soaring oil prices). More recently we have also added to this production capacity through alternative (but more expensive) extraction methods and fuel sources such as Shale and Oil Sands. All up, this year we have an increase in global supply somewhere around 3 mbbl/d.
Then there's OPEC. By tradition, OPEC have usually attempted to manipulate prices through supply, however in recent weeks they made it clear that they are sticking to their 30 mbbl/d production target and announcing that they would be prepared to see oil at US$40 (this is despite 7 or their 12 members desperately calling for production to be cut). There are valid reasons for not cutting production. OPEC members are some of the cheapest producers in the world, so flooding the market with oil puts more pressure on their competitor's margins and ensures that they don't lose market share (in fact, they should gains some). It is kind of a silly thing to do though, as in the end none of the oil producers actually benefit (they all lose).
The net result of all this seems to be that we are producing somewhere around 1 to 2 million barrels per day more than we need. That's a surplus of 365 to 730 million barrels per annum. When people talk about the supply glut, this is what they are talking about.
But how much of a "glut" is this glut?
Let's look at this in perspective.
- Excess production: First, it's worth pointing out that globally we burn somewhere about 91 million barrels a day of the stuff. Unless we all suddenly change our consumption habits this number is expected to grow over time at an annualised rate just short of 1 million barrels per day (US IEA).
- Inventory surplus: As it stands most countries keep a little bit of extra supply on hand. This not only acts as a buffer against changes in actual production, but also geopolitical issues. It shouldn't come as any surprise that some of the largest oil producing nations are also some of the most politically unstable. For the USA that "little bit extra" is equivalent to around 3 weeks' worth of consumption (approx. 380 million barrels, based on ~20 million barrels/day). Across the OECD the future is more conservative, at around 1.5 - 2 months' supply. Whether or not you consider this a lot of inventory depends on how you measure it. In a historical context the USA's 380 million barrels is a massive number, but compared against consumption patterns - and, very importantly, the facilities available to store inventory - these levels are actually a little below trend.
- Supply disruptions (Terrorism): Most of history's "oil shocks" have come as a result of planned and unplanned trade disruptions. Embargoes, civil wars and revolutions have all triggered sudden spikes in oil prices, almost all of which have occurred off the back of periods of below-trend price growth. More specifically, though, in the current environment there are some significant risks we should address. The first is terrorism and the violent expansion of ISIS. Hijacking oil fields has already become a central part of their "corporate structure", funding many of their ongoing terrorist operations. Already it is estimated that a staggering 6% of global supply is from fields "run" by terrorist organisations (that's almost as much as all of Iraq and Kuwait combined). Should ISIS continue to expand their reach, it is likely we will see sanctions or embargoes against countries and groups who take part in trade with the terrorist organisation.
- Geopolitical Supply disruptions (Other Geopolitical): We are also keeping an eye on Russia and Iran. Not only are both major oil producers (Russia in particular), they are both in severe economic crisis. For the security of the region this is a dangerous combination.
- Supply disruptions (Natural & faults): While typically less crippling than all-out war, we shouldn't ignore the impact that natural events (such as floods, hurricanes, tornadoes), and other supply or distribution faults (pipeline leaks, plant shut-down) has on prices. A recent and fairly good example of this was hurricane Katrina. Although the actual damage to oil production and refinery assets was not catastrophic (around 9% platforms across the Gulf of Mexico were taken out of action), the price of Crude jumped by more than 7% overnight. This is despite the US Federal Government having significant inventories in their Strategic Reserve and production only falling by 420,000 barrels per day. In other words, a temporary reduction in supply equivalent to less than 0.5% of total production resulted in a global price increase of more than 7%. We hope we don't see another Hurricane Katrina, but we should be aware that events like this do happen and when they do demand drives the market.
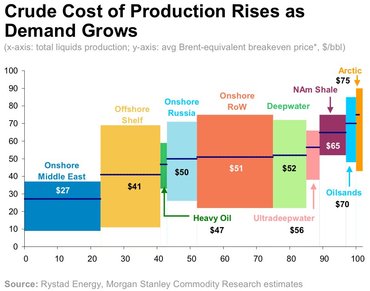
- Marginal Cost of Production: We can speculate as to how low the price might get in the short term, but one this is for sure, over the mid to long-term the only way that new reserves will be extracted is if it can be done so at a profit. Fortunately for us, Morgan Stanley Commodity Research and Rystad Energy have run the numbers to work out the break-even cost of oil, based on source and available supply. What it tells us is that for demand of 50 million barrels per day, the marginal cost of supply would be around US$42/bbl. In fact the marginal cost per barrel is US$43 at 70 million bbl/day, US$44 at 80 million bbl/day, US$47 at 90 million bbl/day, and around US$63 at 100 million bbl/day.
- Trade elasticity: While production is relatively inelastic in the short term there are a few things that can be done to prop up the price. The US, for example, have begun to trim imports and have slightly reduced domestic production. In the past week alone that's resulted in reduction of around 0.9 mbbl/d.
- Green energy & population: There's no disputing that moving toward more renewable fuel sources is the way of the future. The problem is they're still so damned expensive. And even when the gap between the marginal cost of energy closes, consumers are still not "giving up" on their dirty oil-reliant transportation, clothing and industry. Take the US and Australia for example. Per unit consumption does appear to be falling, but not at a level that suggests we are close to a paradigm change any time soon. Regardless, growth (or lack of growth) in wealthy nations like Australia and the US aren't really what is driving the market. Australia's population is around 23 million and the US around 320 million and together we consume around 20 million barrels of oil each day. China, meanwhile, has 1.37 billion people and India 1.25 billion; they consume around 13.6 million barrels of oil each day. I.e., they have 660% more people than us yet use 32% less than us. So let's think about that for a moment. We (Australia and the US), are good at patting ourselves on the back as apparent leaders in the race toward renewable energies, yet we still consume more than 11 times more oil per-person that China and India. If their per-person consumption got to even 25% of our current use, we would need another 25 mbbl/day of global production just to keep pace!! In perspective global demand isn't driven by incremental improvements in non-renewable energy consumption, it's driven by incremental increases in wealth and demand from our much larger and more populous neighbours to the North.
Tipping point
It's true that globally we are producing more than we are consuming. However adjusting for trimmed production the supply imbalance is somewhere in the order of 1.0 million barrels per day (around half the level being reported by most media). Furthermore, there is still plenty of space to store this surplus. In the US alone they have capacity to store an extra 800 million barrels (this is in addition to the roughly 700 million barrels of crude held by the US government's Strategic Petroleum Reserve (SPR).
If the rate of growth in global consumption slows to 0.45% p.a. (half the rate forecast by the EIA) it would take 12 months before US inventories were at 50% capacity, and even after 3 years it would struggle to reach 70% capacity. Sure, if production were to keep growing stronger than growth we might have a problem. But let's consider some of the basics as to why this won't happen.
First, there's the cost. With demand at 90 mbbl/day we are at the "tipping point" where we run out of supply from traditional oil wells and need to move toward alternative sources such as Shale ($65/bbl - US$54) or Oilsands ($70/bbl - US$58). In other words, if demand were set at 90 million barrels per day and global trade was uninterrupted (by natural, man-made and political issues) then the marginal cost of production would be about $56 per barrel (US$47). Of course in reality if prices did reach the marginal cost the only companies who would make these choices were those hoping that prices would rebound (or state run enterprises).
That's the cost of production for existing operators. Like most resource operations there are significant front-end costs, namely exploration and well development. Without the financial incentive, exploration and development is not only unattractive, but potentially unfeasible. How many years will a North American Shale operation be prepared to operate at a loss before they cease production? Six months? One year? Two years? Four years? Pick a number, the end result is the same: production from non-traditional means is not commercial at current oil prices. As oil wells become less productive they are retired (or convert to gas). Without new production filling the gap left by older (more "mature") wells, total supply will fall.
Within this spectrum of marginal production costs lays the central problem with the oil price: current demand is almost precisely at the tipping point between "cheap" and "expensive" oil. Put simply, if global demand was 70 million barrels per day and crashed to 60 million barrels per day, the marginal cost would still be the same (~US$43/bbl). Supply might have taken some time to respond to demand, but over time these changes would have little impact on the underlying production cost of oil. Compare that to today where the difference between 85 and 95 million barrels/day is US$11/bbl (US$43 vs US$54).
It's worth reiterating that global demand isn't the only thing that affects the cost. Even if aggregate demand remained steady, if the US or China were to embargo Russia, for example, we could easily see the marginal cost of production spike to $55 or more.
Summary
So, what can we conclude from this? Well for starters, talk of a US$40-something oil price seems unlikely. At that price (and well before then) we would surely see trade shift toward building inventories and scrapping of all oil exploration and well developments. If it were sustained for any great period of time Shale would become unprofitable and eventually cease (shifting supply imbalance the other way). We also conclude that price is much more sensitive to factors which restrict supply or boost demand than it is to factors which exacerbate any supply imbalance; in other words, there's a greater probability of prices rising than falling.
So, if you think that the US economy is in recovery, or that the industrialisation of China and India will continue, or that oil exploration and development companies will seek to maximise profit, or that there is a fair chance we will see further conflict within the middle east, or that OPEC will face a mutiny if they don't yield to their members' demands, or that the US has plenty of room to build their inventory…then buying oil might be a smart move.
So, if you think that the US economy is in recovery, or that the industrialisation of China and India will continue, or that oil exploration and development companies will seek to maximise profit, or that there is a fair chance we will see further conflict within the middle east, or that OPEC will face a mutiny if they don't yield to their members' demands, or that the US has plenty of room to build their inventory…then buying oil might be a smart move.
Trade ideas
As margins are squeezed we believe that the better risk plays are mid to large-cap producers and intermediaries with low levels of debt. Those with provable supply and production facilities already up and running should be able to weather the storm, even if we did see a oil as low as US$40. There is a fair chance that prices could remain at or below current prices for some time; thus to protect against this we recommend avoiding companies with insufficient cash and efficiency to handle the next 2 years at an oil price sub-US$50. Given the front-end costs associated with exploration and new development, we prefer to avoid minnow producers and exploration companies at this stage.
Geographically, we generally prefer European and North American producers (unhedged) over purely domestic Australian producers both due to their scale and efficiency. We also favour an unhedged $AUD will provide some counter-balance to a slow-down in China and/or improvements in US growth, and as insurance against instability or conflict in the middle east. Some of the companies we currently like include BHP (ASX: BHP; last trade $28.61) and BetaShares' Crude Oil ETF (ASX: OOO; last trade $29.33).
We have a 3 year target price of US$85/bbl (Brent Crude).
Related Updates:
Portfolio Update: BHP Billiton (BHP)
Target price: $USD, Brent Crude (CAGR - Compound Annual Growth Rate):
Current Price: US$59.27 (19/12/14)
December 2015: US$65 (9.67% CAGR)
December 2016: US$75 (12.49% CAGR)
December 2017: US$85 (12.93% CAGR)
Current Price: US$59.27 (19/12/14)
December 2015: US$65 (9.67% CAGR)
December 2016: US$75 (12.49% CAGR)
December 2017: US$85 (12.93% CAGR)
Update - 23/12/2014, 13:41 pm
OPEC have re-stated their intention to retain production at current levels and have said that they may even consider increasing production. My reading of the situation that this is an attempt by OPEC to bluff US energy suppliers into scaling back production faster than they already are. This spells further uncertainty for investors in oil producers and refineries, however has relatively little impact on the underlying demand and production costs of oil (remember, excess supply will turn most Shale operations unprofitable, but does little to change the marginal cost of production).
We reaffirm our previous guidance. March 2015 Brent Crude futures currently trading $60.91.
Note: Portfolio updates reflect the views of the author and are not to be interpreted as personal advice. Consult your adviser before deciding whether this investment is right for you.
TSA Capital Markets [email protected]