School performance (2008-2016)
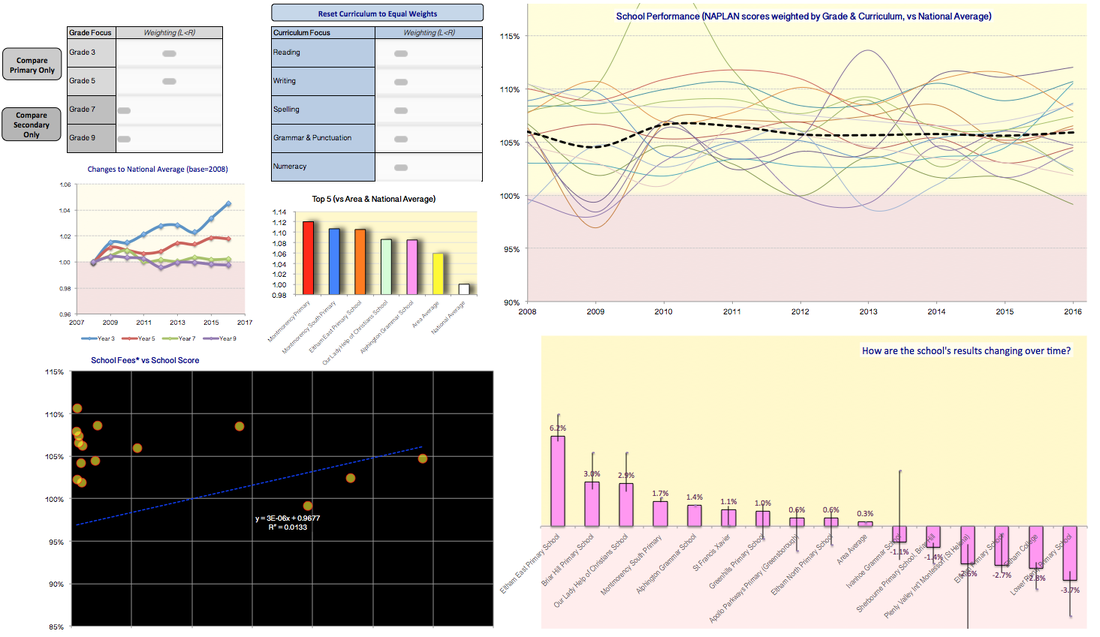
Instructions:
- Drag the 'Grade Focus' and 'Curriculum Focus' sliders to adjust weights. All data is scaled, so they don't need to add to '100%'; this will happen automatically.
- 'School Fees' reflect parent contribution and exclude voluntary contributions and fundraising.
- The table 'How are the school's results changing over time?' looks at results over the past three years. The pink bar is an estimate of how results are changing, weighted by recency, while the single line indicates range of results. Best results are from schools that are improving (pink bar above the horizontal axis), and with a narrow range (indication of consistent improvement).
- I have only included a few schools that include both primary and secondary. Therefore comparing results that include a 'Grade Focus' that covers primary and secondary will provide much smaller sample.
- Excel spreadsheet requires Macros to be enabled. These are linked to buttons such as 'Compare Primary Only', and 'Reset Curriculum to Equal Weights'. Depending on computer speed it may take a few seconds for these buttons to work (they need to recalculate and re-plot the graphs).
- Here is an other interesting discussion about school choices, fees, and student performance: ABC The Money: Family Finances and School Choice.
| naplan_school_analysis_v.04____270917.xlsm |