Data analysis tools & spreadsheets
A sample of recently built tools and spreadsheets.
Portfolio Construction & Risk Analysis:
- TSA SAA Calculator
- TSA Discounted Cash Flow Analysis
- Risk adjusted cash flow analysis for long term investors.
- Monte Carlo Simulation (risk, cash flow & performance analysis)
- Portfolio Optimisation (non-Markowitz)
- Retirement, Savings & Quality of Life
- Volatility-Adjusted Returns (explaining the impact of time, leverage and cash flows on final wealth)
- The impact of tax on trade decisions and investment returns
Economic & Market Analysis
- The Case for Cash (market valuation)
- Schiller CAPE Analysis (R, Shiny)
- Mean Reversion or Momentum: what works? (study using algorithms in Python)
- Effects of Monetary Policy and Risk Premiums on Asset Price Returns (asset pricing)
- Property vs Shares (Simulator)
Other
- 4Sight (trading simulator)
- Superannuation Fund Review 2017 (analysis of all major superannuation funds, approximately $1 trillion AUM)
- Investing in Small Business: Analysis of cash flow and capital structure
- Small Business Valuation
- Life Expectancy Calculator
- Income Tax Calculator
- Recommended Reading
Portfolio Construction & Risk Analysis
|
TSA SAA Calculator
|
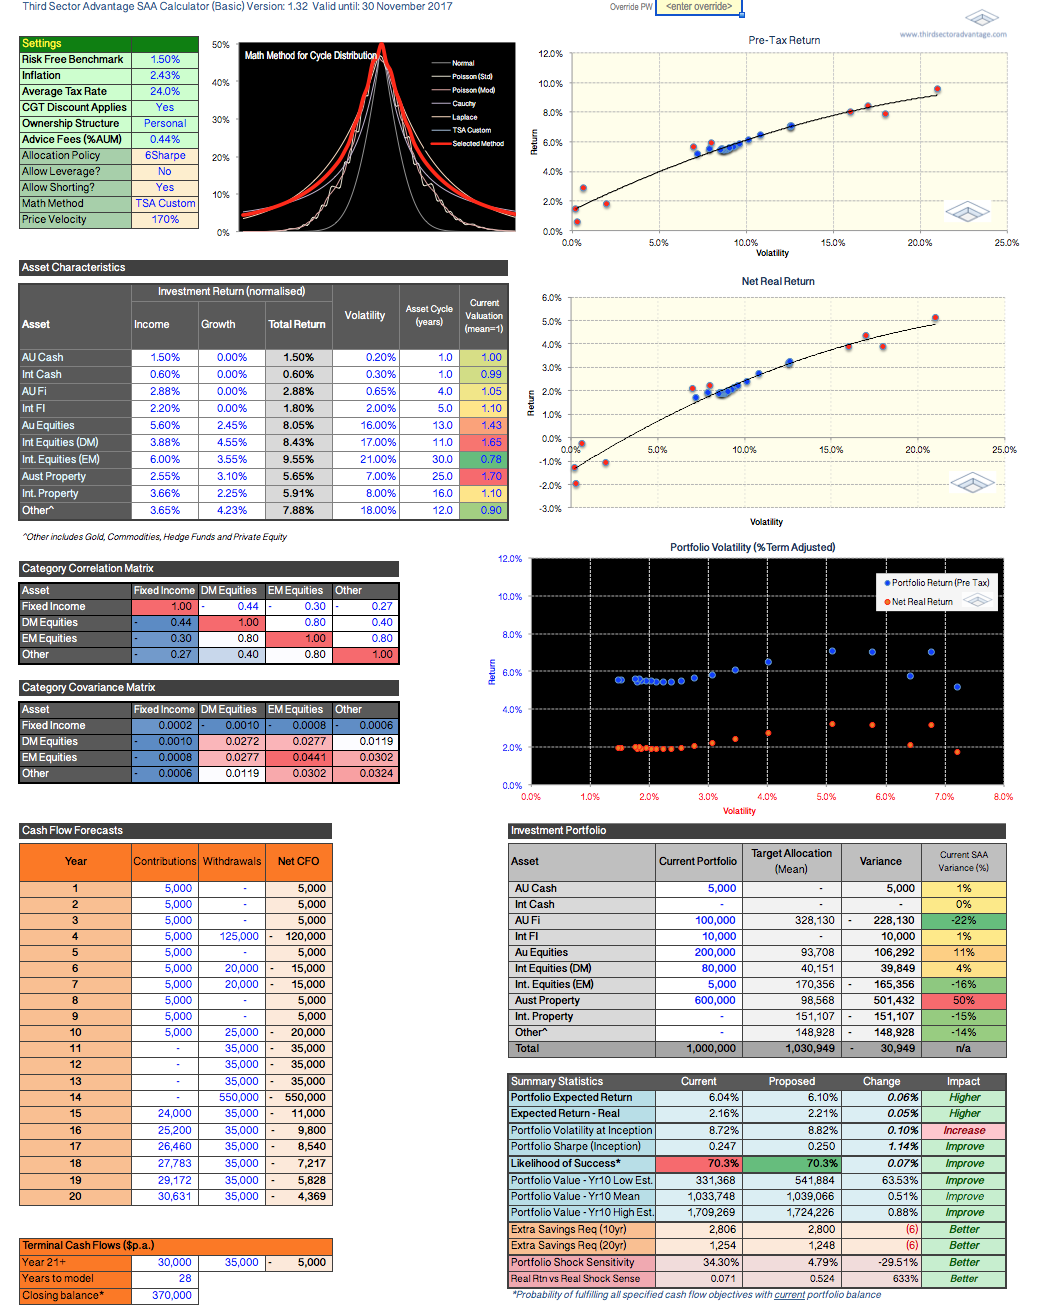
Designed for financial advisers, this simple-to-use Strategic Asset Allocation Calculator allows the user to set not only return and volatility estimates, but also to specify more detailed characteristics of major asset classes, including correlation, cycle length, current valuation (relative to fair value or mean), and fees and taxes. We even provide the ability to tailor math methods, price velocity, leverage, short positions and allocation methods (high or low diversification).
Once these variables have been set, the user only needs to complete their "current" portfolio and cash flows (contributions and withdrawals), and the calculator will recommend a portfolio that provides their optimal risk-adjusted return. Although designed to be incredibly user-friendly, there are several methods used in our allocation process that I believe makes it more robust than traditional MPT methods (such as Markowitz optimisation). For example, our model factors in the "shape" of volatility and prices over time, as well as sequence of cash flows. We also include Shock Sensitivity. This indicator uses data about pricing anomalies, cycles and Price Velocity to estimate the impact from a normal market "shock" (normal being an event expected every 7 - 12 years, on average). We also reframe this risk as a real return-risk ratio. This should be a focal point for advisers as it indicates the level of loss (drawdown) investors can realistically expect to bear over a normal market cycle with their current and recommended asset allocations. Although users should be aware of the key concepts underlying the allocation strategy, they do not need to have a full understanding of the math in order to make use of this tool. |
|
TSA Discounted Cash Flow Analysis
|
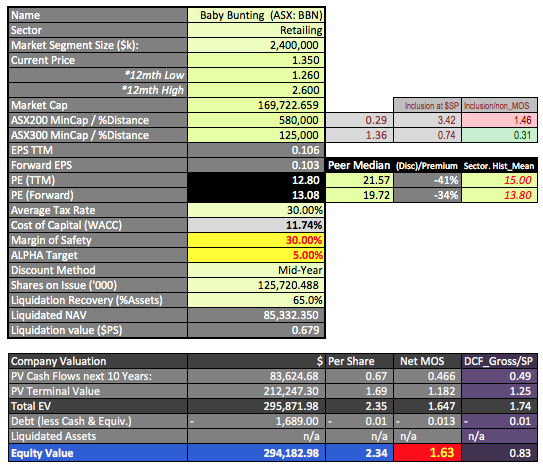
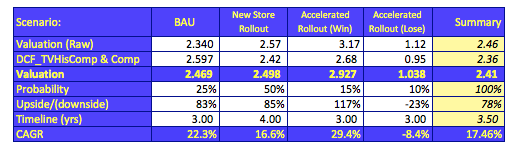
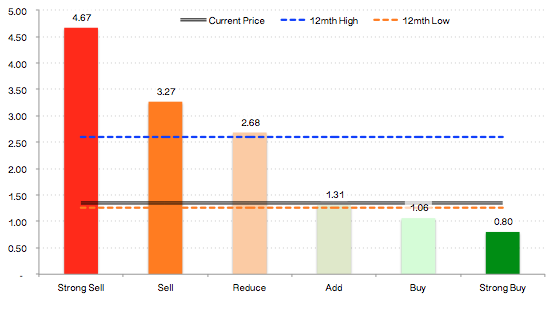
For the most part, our Discounted Cash Flow (DCF) analysis follows the traditional model for projecting P&L line items. However, in an effort to create a more robust, yet flexible model, I have incorporated a number of additional features, such as:
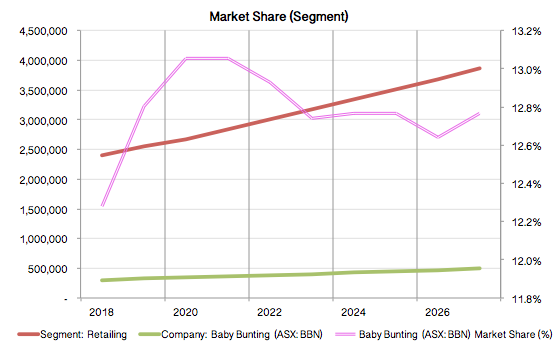
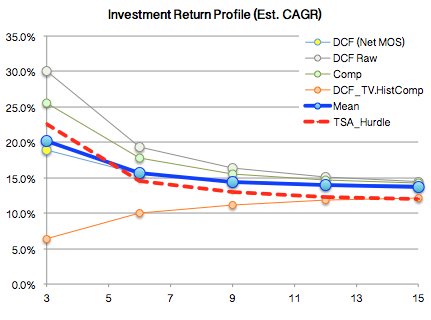
Example: Baby Bunting (ASX: BBN): The last year has been challenging for Baby Bunting shareholders, with the company's share price falling by nearly 50% as investors consider the effect of lower margins and the much anticipated (dreaded) arrival of Amazon. Though this makes for tougher trading conditions - at least in the short-term - our analysis suggests the market has overreacted. Starting with margin compression: As Australia's dominant player in baby goods retailing, Baby Bunting's continues to hold the most attractive operating margin and to a large degree has been the instigator of lower margins. This, in turn, has contributed to the failure of several of BBN's competitors. As we should expect, the liquidation of their rivals has caused somewhat of a surplus of at-or-below-cost stock to flood the market, which in turn has led to some weakness in BBN's short-term profitability. Overall, however, I believe this is a net positive for the company: They have clearly indicated their desire to grow, and with a very strong balance sheet they might decide this is an opportune time to accelerate their expansion. I estimate that an investment of between $15 - $25 million could bring their plans forward approximately four years, and contribute up to $10 million per annum of free cash flow. Regardless, we expect to see margins rise again in coming years, and earnings growth to outpace that of the sector as they mop up the gap left by their competitors. The second issue worrying investors is Amazon. If we look to the experience of other developed markets, within baby-goods Amazon has been able to capture around 5% of total segment sales. We will have to see how products, prices and warranties compare, but intuitively, on the whole we should see online retailers more adversely affected than BBN's "bricks and mortar" oriented business; this should help insulate earnings. We have determined a Fair Value of $2.34 ($1.63 net MOS) for BBN's existing product lines, with a potential value as high as $3.17 should they successfully use their competitor's weakness to increase market share. Our valuations suggest BBN's shares are substantially undervalued and offer investors potential upside of between +73% and +135% (3 year CAGR of 20% to 33%). Review ref: BBN.140118 |
|
Risk Adjusted Cash Flow Analysis for long term investors
|
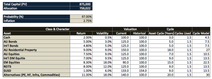
This model allows the user to analyse the specific properties of valuation anomalies and deconstruct returns by earnings yield (or FCF), earnings growth, inflation and price change. Scenario analysis incorporates cash flows, allowing us to better compare outcomes from different portfolio allocations.
This type of approach is ideal for investors with very long investment horizons, who are making "lumpy" contributions or large withdrawals from their portfolio. For example, Not for Profit foundations and recent retirees. |
Monte Carlo Simulation - Portfolio modelling
|
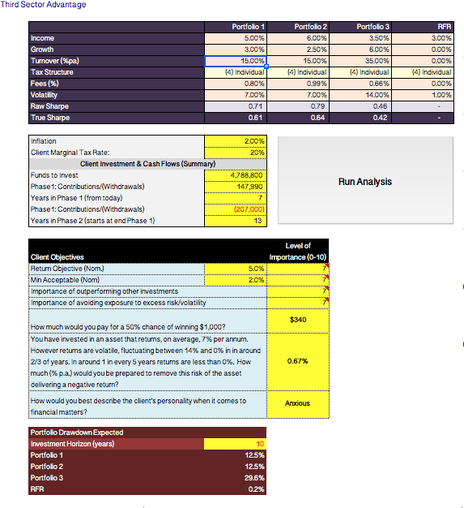
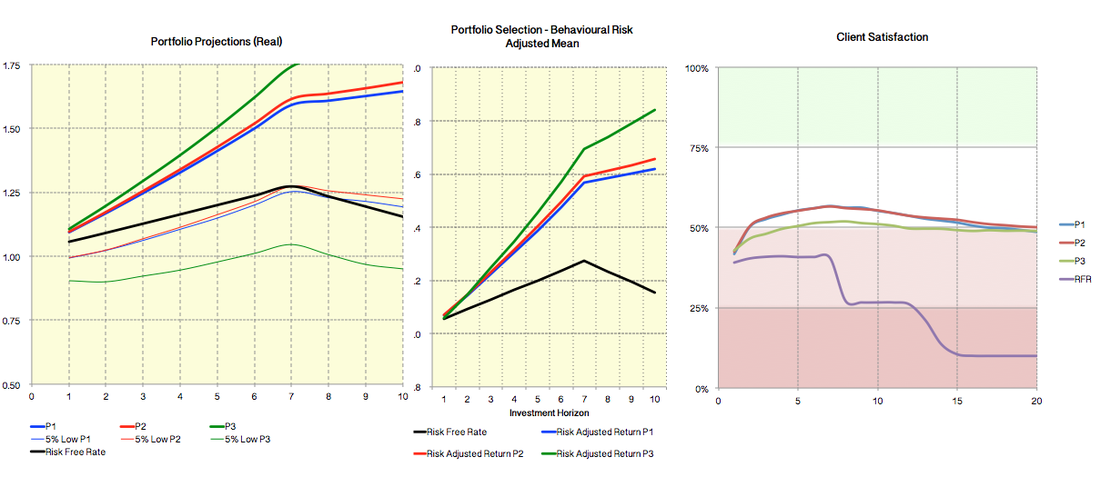
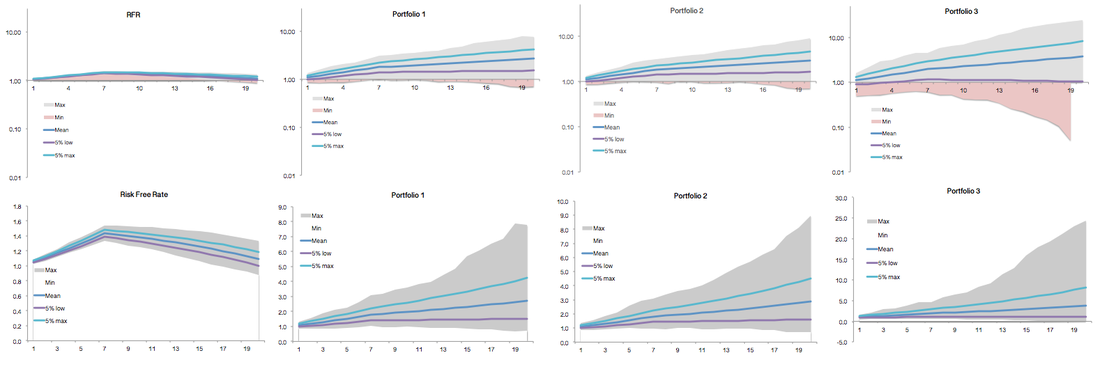
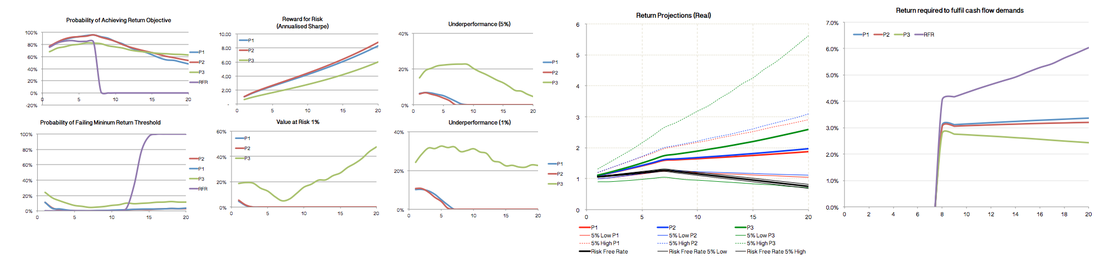
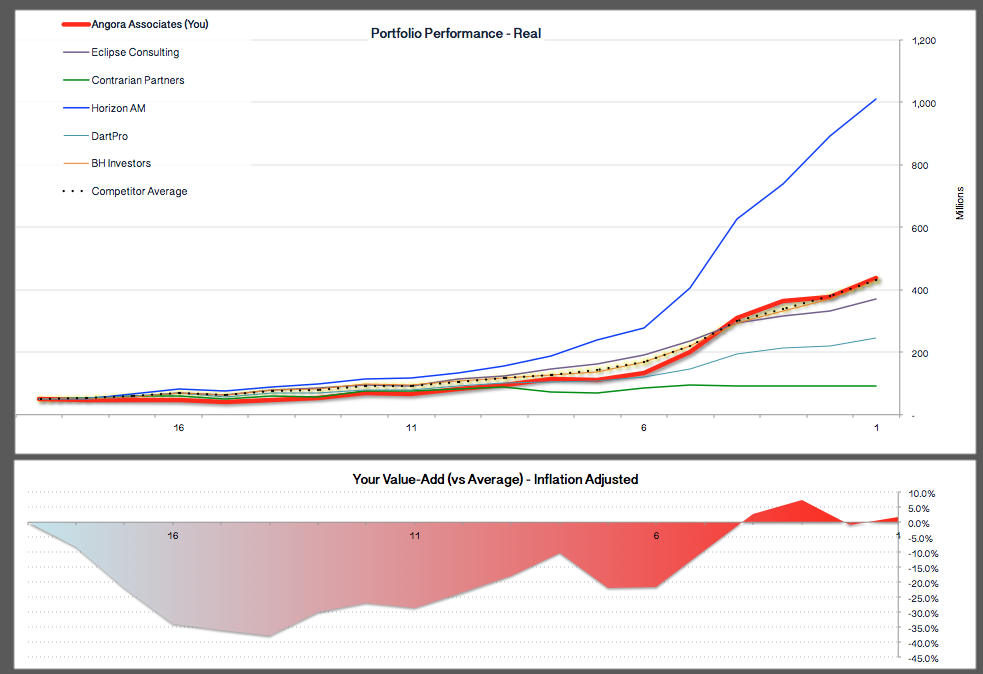
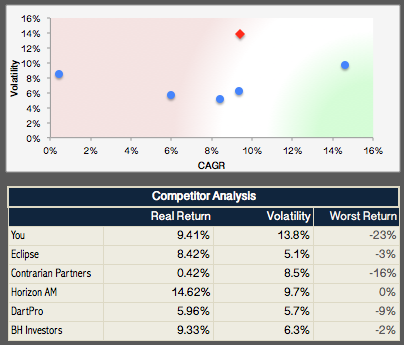
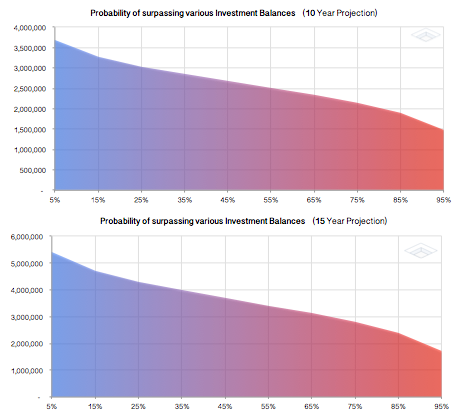
This Monte Carlo simulator provides a comparison of three portfolios (plus Risk Free Rate), with ability to incorporate the impact of tax, fees, composition of returns, portfolio turnover, return objectives and inflation. Simulations incorporate client cash flows (contributions/withdrawals).
Analysis includes the following:
We also incorporate several qualitative factors, such as the client's personality and the importance of reaching certain goals as a way to gauge a client's risk tolerance and, specifically, the influence of behavioural bias (eg: loss aversion, mental accounting, framing). |
|
Portfolio Optimisation (non Markowitz)
|
This was one of our first Portfolio Optimisation tools to incorporate both valuation anomalies and asset cycle length in our estimate our asset return trajectory. This model uses a normal distribution to factor in mean reversion (in a manner consistent with Time Decay) to predict future returns.
Though the math behind this approach is solid, we have since improved our model to account for Price Velocity and "fat tailed" distributions. We do this applying distribution frequencies of Cauchy or Laplace as we believe this better reflects "real world" market behaviour. As with our other models that incorporate asset cycles and pricing anomalies, as time moves forward investment allocations automatically adjust to reduce risk at the short end of the portfolio while reacting to changes in the relative value of assets. This has the effect of reducing exposure to assets as they become overvalued, and increasing exposure as they become cheap. |
|
Retirement, Savings & Quality of Life
|
Designed specifically for those approaching retirement, this tool helps illustrate the trade-off between household savings, income, expenses, and retirement.
This calculator separates retirement into two phases. The first phase is what we refer to as "active" retirement years, while the second phase is more sedentary. As the name implies, "active" are the years where the client is most physically able to enjoy their retirement and tick items off their bucket list. As advisers, I believe it is our duty to provide our clients with advice that properly considers both the financial and social/practical aspects of our clients lives. This tool helps clients to understand the impact that even small changes to their situation can have on their lifestyle in retirement. For example: In the example to the right, this person's goal of retiring at 62 years of age is achievable, and from their current age and position results in about 37% of their future life being spent saving (working), 35% in active retirement (Phase 1), and 28% in the second phase of their retirement. If, however, they reduced their household expenses by about 6% they could change these proportions to 22%, 50% and 28%; a 40% increase in their active retirement years. |
|
Volatility-adjusted returns: adjusting for time, cash flows and leverage
|
A simple model to help clients better understand the difference between volatility and risk. We illustrate that even for a risk-averse investor, the mean-reverting nature of many assets produces a non-linear distribution of outcomes that, over time, can present an excellent opportunity to enhance returns.
We also include examples showing the difference in outcomes if their "exit" is brought forward or pushed back 10 years (this was made for aspiring retirees, or investors with a specific investment horizon). By educating our clients on the impact that volatility has on investor behaviour and expectations, we find that many investors come much more accepting of volatility and comfortable taking a long-term view of their investment journey. |
|
The impact of tax on trade decisions and investment returns
|
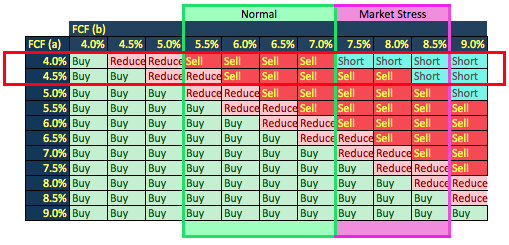
The idea behind this calculator is to incorporate the impact of tax into a rules-based trade decision matrix.
We start with a focus on changes to the Free Cash Flow yield (FCF/Price) over time. Next we incorporate investment term, stock turnover, GDP Growth Rate and tax rates we can calculate the cumulative net balance at completion of the specified investment term. By comparing this return to volatility (also adjusted to term) we can estimate the probability that our total net return will be equal to or less than 0%. We also approach the math from the opposite direction; comparing the term of investment needed at the future FCF Yield to match the return generated by the current FCF Yield over the full term. Where our future FCF Yield is higher this produces a shortfall, which we can apply to the difference in term (full term less term invested at future FCF) and magnitude of changes in FCF Yield relative to volatility (here volatility is simply multiplied by the square root of time). From these results we can apply rules. In the accompanying example we use these portfolio statistics to inform the investor whether to Buy, Hold, Reduce, Sell or Short. |
Economic & Market Analysis
|
The Case for Cash
|
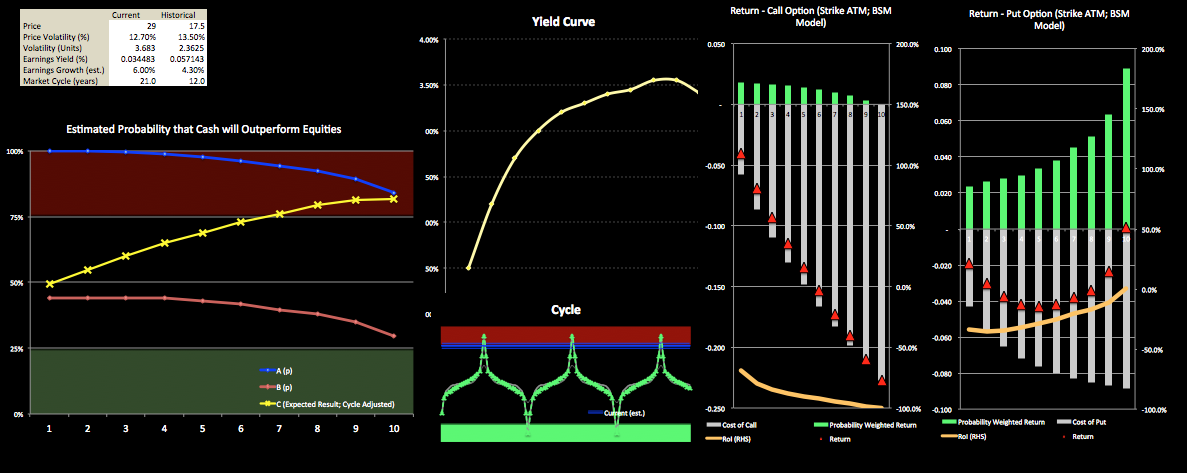
Consider a scenario where cash is yielding 1%, and equities, although looking incredibly expensive, are still offering a yield of about 5%. Your client is fairly risk averse, yet requires 6% per annum to meet their long-term objectives. What do you do?
This model is designed to help answer this question. Here we compare the cash flows of an asset (such as equities, infrastructure) against a the yield curve of a risk-free benchmark. We then calculate how much our risky asset's price must fall to eliminate the return advantage, and convert this into a probability based on the asset's valuation relative to fair value, and the cycle length of that asset. This model does not tell us by how much an asset might under or out-perform, but rather the probability it will happen (a model that includes the magnitude of change is included in our "H-Minus" model). We also include a snapshot of the return profile from both Put and Call ATM options (BSM). This is particularly useful for investors with large unrealised capital gains and highly variable tax rates who might wish to defer the sale of assets. In this case we find that for investors carrying significant capital gains, investing in Put options may provide a more cost-effective* way of reducing risk than selling the asset outright. *Mathematically, the decision can be made for us using the formula: Trigger = { (1.0 / [ CGT / {CPT x (1-t)} ] )-1 }/(Stdev.^T) Where "Trigger" is the level of absolute protection the investor wishes to have; this model will see less risk averse clients prefer buying options over selling their shares in order to retain potential upside. Other inputs are:
|
|
Schiller CAPE Analysis (R, Shiny)
|
An interactive dashboard illustrating the distribution of the Cyclically Adjusted Price-Earnings Ratio (Case-Shiller PE, or CAPE).
This application was built using R (code), with graphics interface loaded through Shiny App. Data sourced from Professor Shiller (Yale University), with CSV files uploaded from Quandl. Current to July 2017. |
|
Mean Reversion vs Momentum: what works?
|
What can past returns tell us about future risk and returns?
Our analysis seeks to help determine whether there is a connection between recent returns (over varying look-back periods), and future returns. If there is, a positive connection may suggest that long-term alpha can be generated through momentum-oriented strategies, while a negative connection might suggest that mean-reversion is the dominant force. Given the vast amount of data involved I wrote an algorithm in Python to sort, rank and measure 208 different combinations of time, liquidity and performance. This algorithm was deployed within the Quantopian IDE and covered a full ten years (120 months) of data, up to and including 31 January 2018. Our results were then entered into Excel where we incorporated a function to allow the user to specify factor weights and rules to help select portfolios (Qualifying Portfolios). I also experimented modelling the final results through MATLAB's GUI. This research uncovered some surprising results on the impact that liquidity may have on prospective returns from both mean-reversion and momentum oriented approaches to algorithmic trading. We find that over the sample period an investor could have earned superior risk-adjusted returns by combining both approaches. |
|
Effects of Monetary Policy and Risk Premiums on Asset Price Returns
|
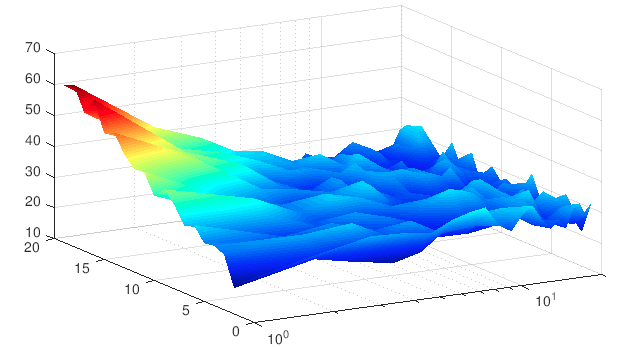
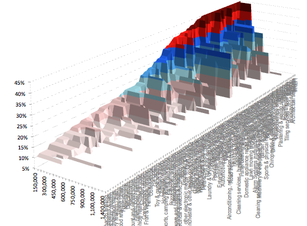
I built this spreadsheet as I was interested to see whether there was a way to quickly and easily illustrate the effect of changes to monetary policy and market risk premiums for publicly listed companies with different capital structures.
To do this, we approach the problem from an accounting perspective; starting with our RoA and analysing the effects of leverage on earnings, then letting our estimates of market risk tell us how we expect the market to price these companies. From there we can make changes to our estimates of interest costs, growth rates and risk premia, plus the time we expect it to take for our forecasts to persist before returning to more stable market conditions. Also included is inflation data, which is used to predict changes to interest rates using a version of the Taylor Rule. Results are provided in a separate three-dimensional wireframe. |
|
Property vs Shares (Simulator)
|
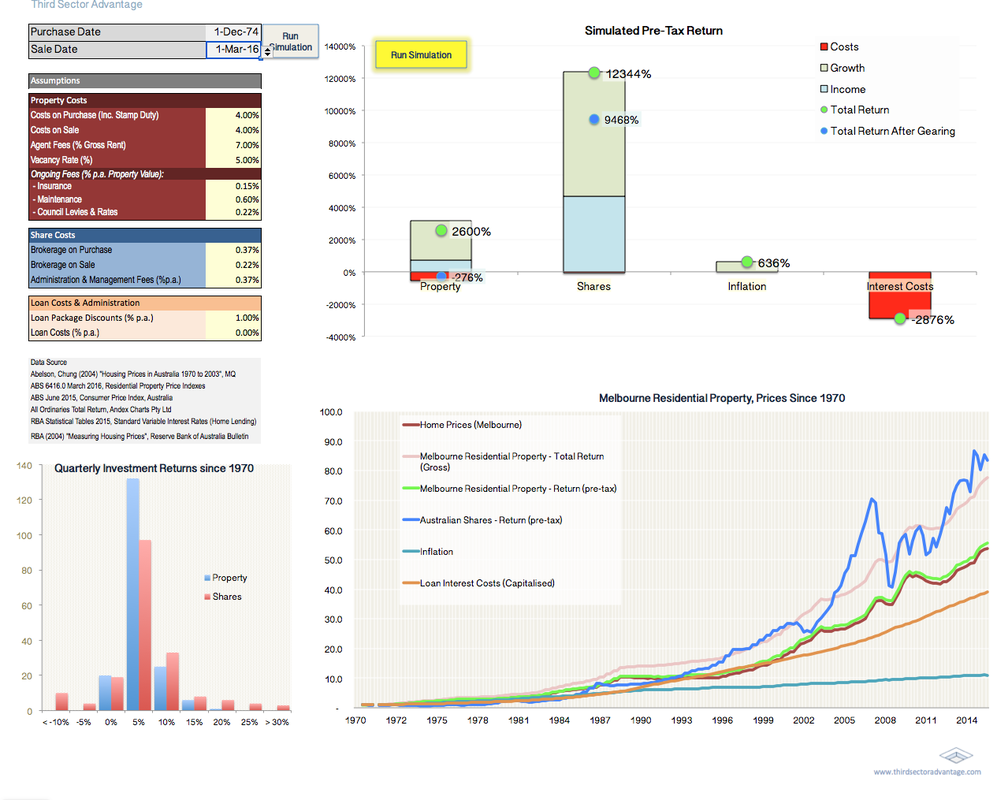
This simple calculator was designed to accompany a series of research reports I prepared that discussed property economics and the factors influencing supply, demand and prices of residential property.
My objective was to provide a very simple way for investors to quantitatively compare "what if" scenarios, without the anecdotes and hyperbole popularised by the media and, in many cases, clients' friends and family (this is particularly relevant for younger clients who feel pressure to "get into the property market" before it's too late). Note A more detailed discussion of property economics is covered in our IWS Residential Property Review (revised and republished every 2 - 3 years). Our study reviews not only the history of Australia's residential property market, but the impact that shifts in demographic, tax dependency ratios, interest rates, legislation, household debt and discretionary income has on property supply, demand, policies and prices. |
Other
|
4Sight (trading simulator)
|
4Sight is a trading simulator designed to help advisers test, learn from, and improve their investment decision-making processes.
This simulator uses an algorithm to convert real-world (non-parametric) returns and incorporate exogenous variables, such as political, economic and market events. Importantly, while the data driving the simulator is real, to encourage investors to look at the data supporting their investment decisions, the names of countries have been changed. Investment costs are also included, as are alternative assets such as residential real estate and commodities. To test the investor's skill level, 4Sight also pits the investor against other investors, each of which is programmed to implement their own unique investment style. Background The ideas behind 4Sight not only come from observing the behaviour of investors (and investment advisers) but also from the growing body of research into neurofinance which finds that investors' decision-making process and abilities are often influenced by the body's physiological responses to stimuli (in particular the cognitive response to fluctuations in testosterone and cortisol). Learning to compensate for, if not control, one's biases (emotional, cognitive and chemical) sets the framework for a more rational, robust and consistent approach to investment and risk management. |
|
Superannuation Fund Review (2017)
|
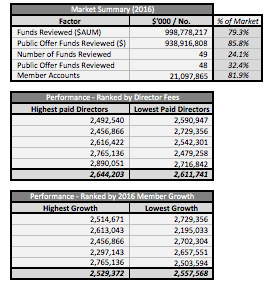
For many people, choosing a superannuation fund can be a daunting task. This calculator was prepared to help simplify the process.
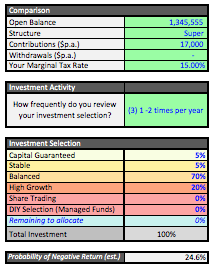
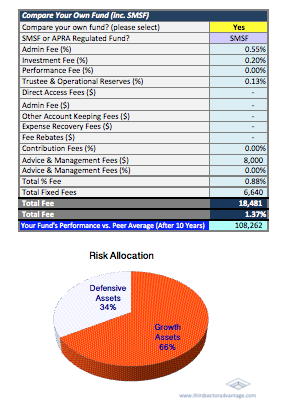
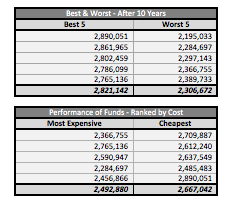
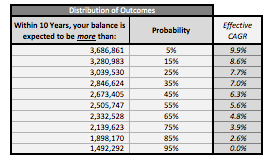
Here we compare Australia's largest 49 public offer funds which together represent over 21 million individual accounts, with a total value of approximately $1 trillion, or 79% of the total assets managed by APRA regulated funds. In addition to analysing fund performance and fees, our analysis considers client cash flow (contributions and withdrawals), investment strategy, taxation, and member engagement in order to identify the funds most likely to meet their requirements. |
|
Investing in Small Business: Analysis of cash flow and capital structure
|
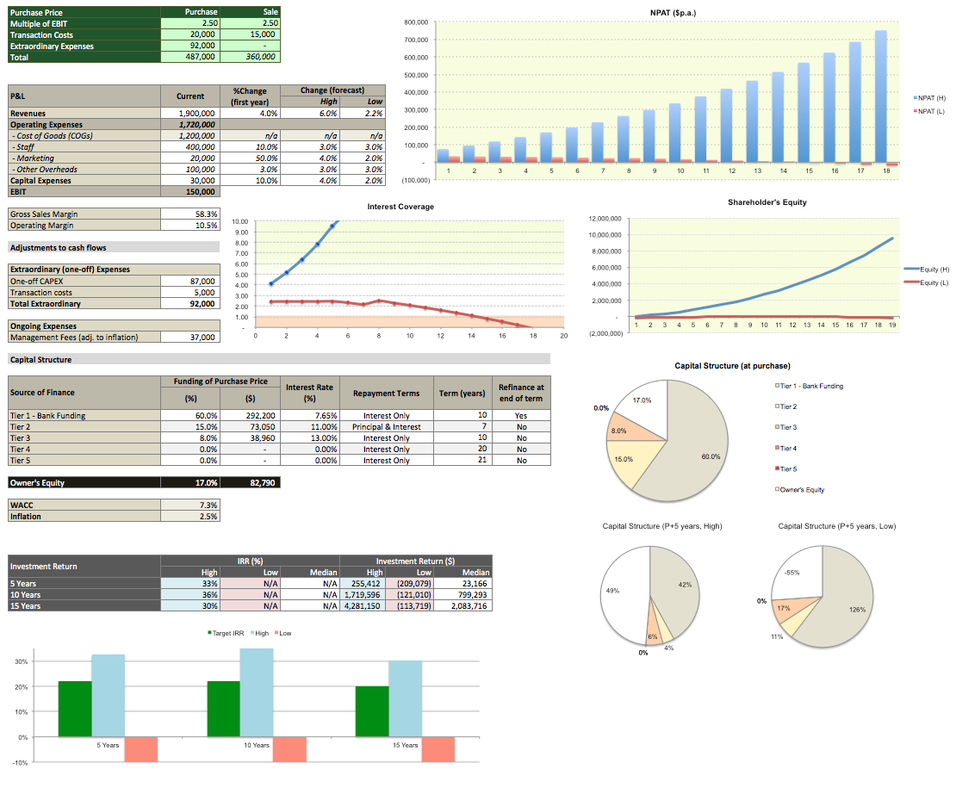
A simple to use calculator illustrating the effect of leverage, risk, and changes in the P&L on shareholder wealth.
This spreadsheet isn't intended to replace a business plan, rather it is designed to be used as a "sanity check" for prospective purchasers, allowing them to quickly and easily see the effect of different funding structures and changes in business performance measures. This model contains a number of particularly useful features. For example, we provide the ability to model a two scenarios ("High" and "Low"). This is to encourage prospective investors to think about what might happen if business conditions deteriorate. We also include options to adjust earnings for both extraordinary and recurring items. An example here might be an allowance for a "Management Fee" by the new owner, or a large capital expense to launch a new product line or service. Example The example to the left is for a suburban tyre fitting franchise. The purchase was to be funded 60% bank, 23% from private funding sources (including vendor finance), and 17% ($83,000) by the investor. Included in this purchase price is $92,000 to purchase a new vehicle and equipment customised to provide a "mobile tyre fitting" service. We have also allowed for a very aggressive marketing strategy, with a 50% increase in marketing allowance in year one, plus a substantial pay rise for existing staff; our objective here is to ensure key staff are retained, and to attract high performers from local competitors. Although he is not intending to be involved in the day-to-day operation of the business, the investor has also included Management Fees of $37,000 per annum. From this we see that if the business meets it's revenue targets, the investor's 10-year IRR is approximately 36% p.a., or a return of about $1.7 million on his $83,000 investment (this is in addition to Management Fees received). We also see that our low-range estimates result in a 10-year loss of about $121,000 (representing his initial $83,000 investment plus cash losses of about $38,000). Armed with this information, the investor may reconsider his growth strategy and capital structure. |
Small Business Valuation
I hold an active interest in small business valuation, both as an advisor to several small to medium sized businesses, and also as a private investor. To help me stay on top of changes in industry valuations and opportunities I actively maintain several databases with valuation statistics and financial case studies.
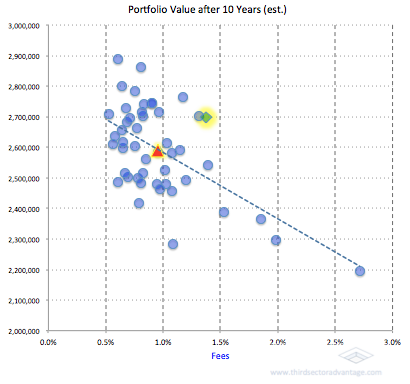
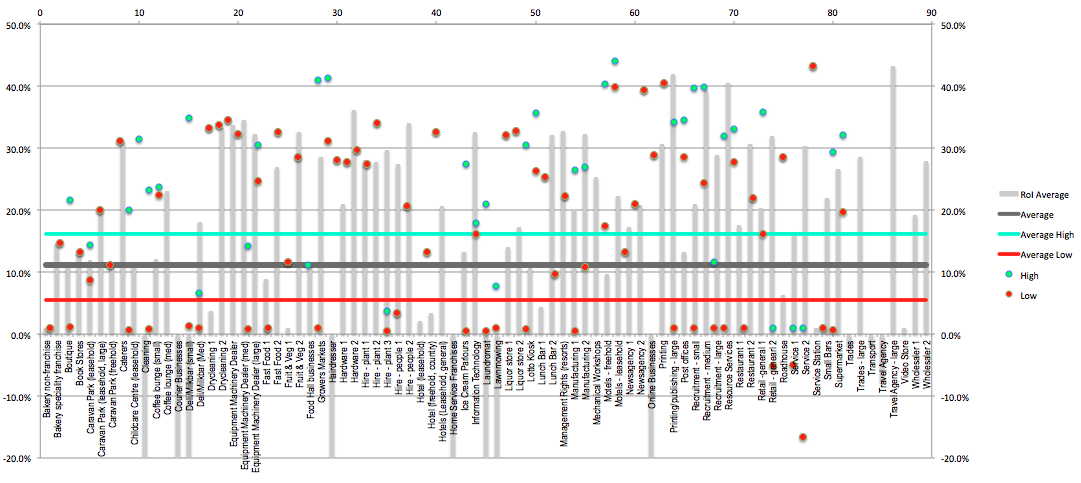
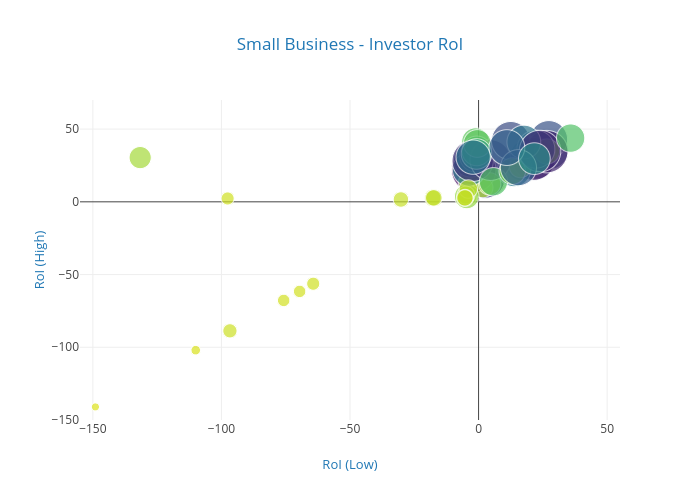
The chart below compiles data from several sources over the period from 2013 to 2017, and adjusts sale prices for inflation and owner (management) wages. The result is an implied EBIT compared to sale price, or Return on Investment (RoI).
Although I am highly critical of valuing businesses on a RoI basis, I produced this to help in a recent negotiation in the sale price for one of my client's businesses. The business' accountant had previously valued the business on an RoI basis, using data that had "added back" owner wages (as is common with statistics provided by business brokers). As the comparison being used as a reference point was a much smaller company (EBIT of around $270k, before deducting owner wages, versus my client's business' EBIT of $620k, after wages), the original RoI used by the company's accountant was 60%, when it should have been closer to 29%. By correcting the accountant's calculations, and using my database of business valuations as evidence, we renegotiated the value to sell with an implied RoI of 38%, thereby increasing my client's payout by 58% (nearly $300,000).
|
|
|
Life Expectancy Calculator
|
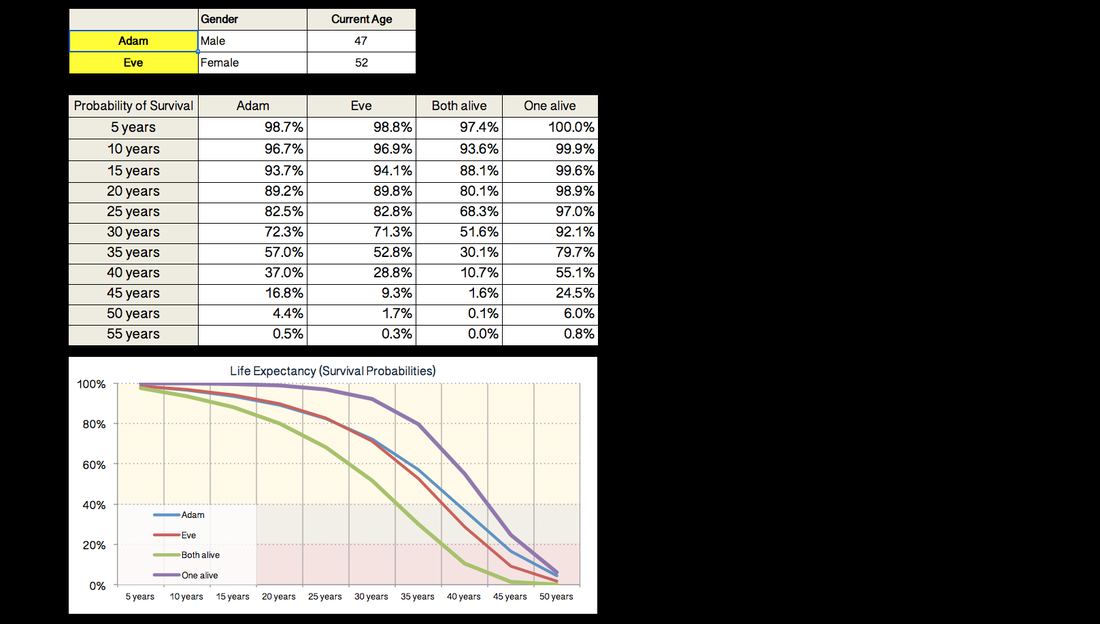
Based on Australian Life Tables (2014), this simple life expectancy calculator is designed to help with client discussions around issues such as capital adequacy and the risks of outliving their retirement savings.
|
|
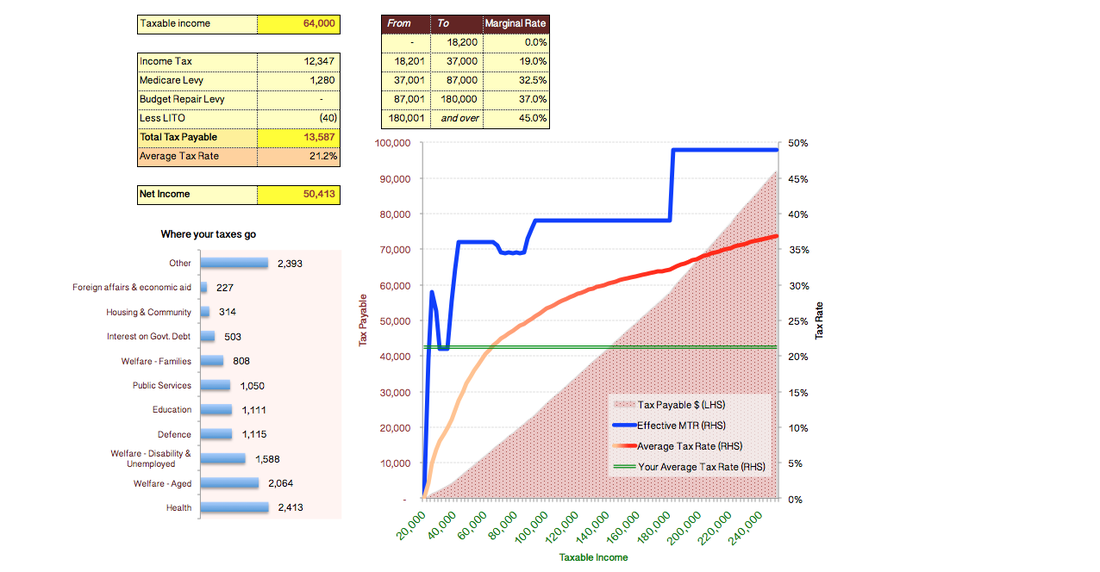
Income Tax Calculator
|
A quick and easy Income Tax calculator (based on tax rates announced in the 2016 Federal Budget).
|
|
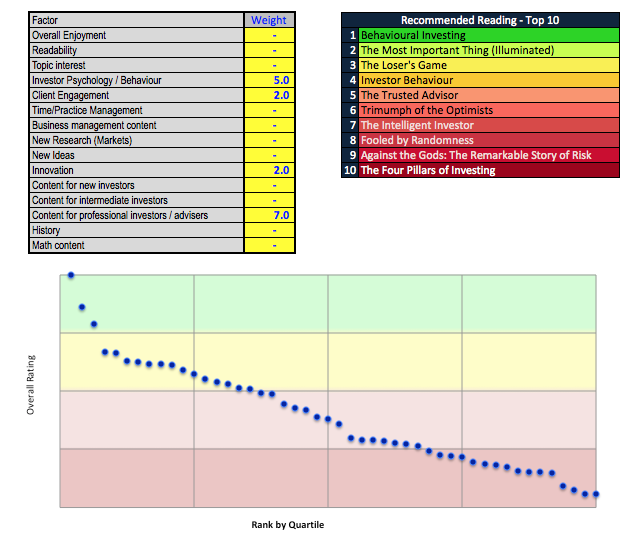
Recommended Reading
|
I and am often asked by clients and other advisers which books I might recommend on different subjects.
To help answer this question, I recently started tracking my reading list; ranking each book by a range of factors, such as readability, innovation and content subject. This way I can easily supply a "Top 10" list that will suit the person's topic interest and level of knowledge. It is also helpful for me, as it identifies which books might be worth re-reading. As I only recently started recording my reading list, there are only around 70 books loaded. Over the next 3 - 5 years I hope to round this out to 200 - 300. |