Data analysis tools & spreadsheets
A selection of the spreadsheets, dashboards and applications used by Insight Wealth Solutions:
Portfolio Construction & Risk Analysis:
Economic & Market Analysis
Other
Portfolio Construction & Risk Analysis:
- TSA SAA Calculator
- Risk adjusted cash flow analysis for long term investors.
- Monte Carlo Simulation (risk, cash flow & performance analysis)
- Portfolio Optimisation (non-Markowitz)
- Retirement, Savings & Quality of Life
- Volatility-Adjusted Returns (explaining the impact of time, leverage and cash flows on final wealth)
Economic & Market Analysis
- The Case for Cash (market valuation)
- Schiller CAPE Analysis (R, Shiny)
- Property vs Shares (Simulator)
Other
- 4Sight (trading simulator)
- Superannuation Fund Review 2017 (analysis of all major superannuation funds, approximately $1 trillion AUM)
- Investing in Small Business: Analysis of cash flow and capital structure
- Life Expectancy Calculator
- Income Tax Calculator
Portfolio Construction & Risk Analysis
|
TSA SAA Calculator

|
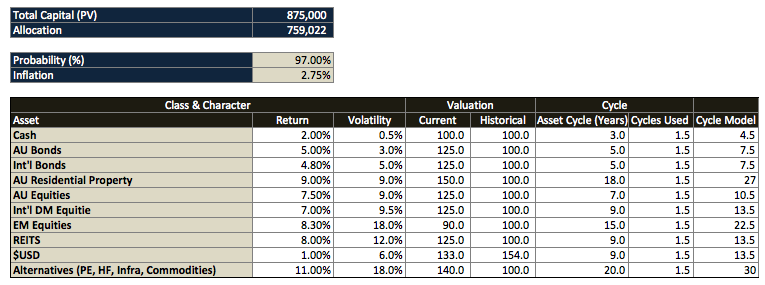
Designed with financial advisers in mind, this Strategic Asset Allocation Calculator allows the user to set not only return and volatility estimates, but also more detailed characteristics of major asset classes, including correlation, cycle length, current valuation (relative to fair value or mean), fees and taxes, plus options to tailor math methods, price velocity, leverage, short positions and allocation methods (high or low diversification).
Once these variables have been set, the user only needs to complete their "current" portfolio and cash flows (contributions and withdrawals), and the calculator will recommend a portfolio that provides their optimal risk-adjusted return. Although designed to be incredibly user-friendly, there are several features to our allocation process that makes it more robust than traditional MPT methods (such as Markowitz optimisation) that are unable to account for timing of cash flows or the "shape" of volatility and prices over time. We also include Shock Sensitivity. This uses data about pricing anomalies, cycles and price velocity to estimate the impact from a normal market "shock" (normal being an event expected every 7 - 12 years, on average). We also reframe this risk as a real return-risk ratio. Shock Sensitivity should be a focal point for advisers as it indicates the level of loss investors can expect to bear with their current and recommended asset allocations. Although users should be aware of the key concepts underlying the allocation strategy, they do not need to have a full understanding of the math in order to make use of this tool. |
|
Risk Adjusted Cash Flow Analysis for long term investors
|
This model allows the user to analyse the specific properties of valuation anomalies and deconstruct returns by earnings yield (or FCF), earnings growth, inflation and price change. Scenario analysis incorporates cash flows, allowing us to better compare outcomes from different portfolio allocations.
This type of approach is ideal for investors with very long investment horizons, who are making "lumpy" contributions or large withdrawals from their portfolio. For example, Not for Profit foundations and recent retirees. |
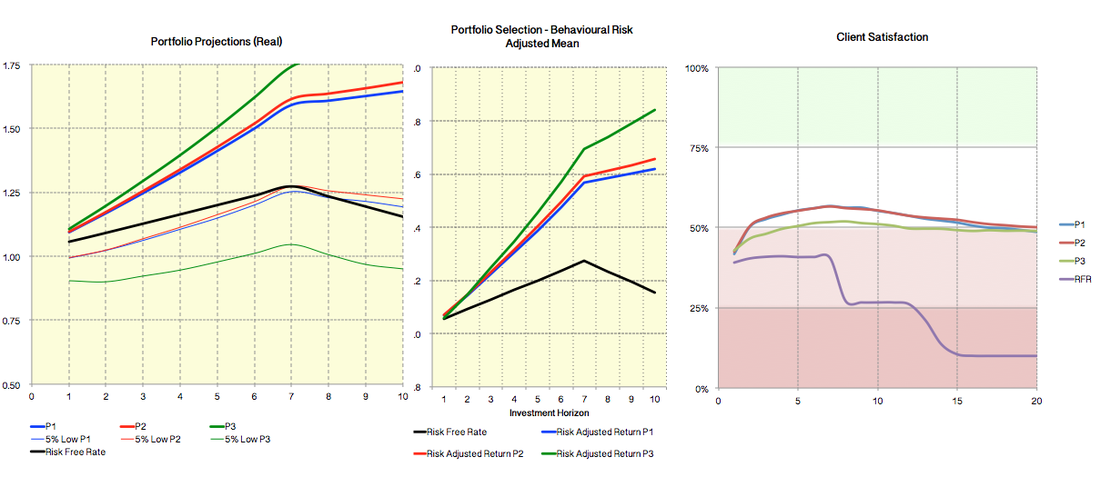
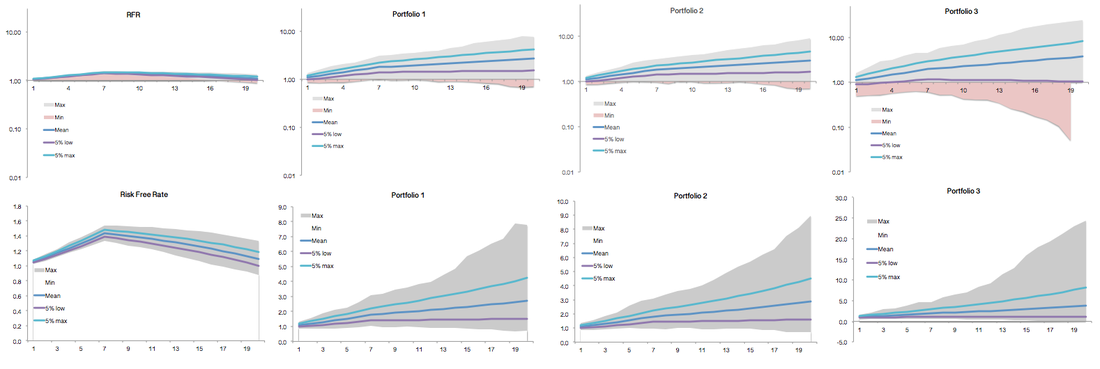
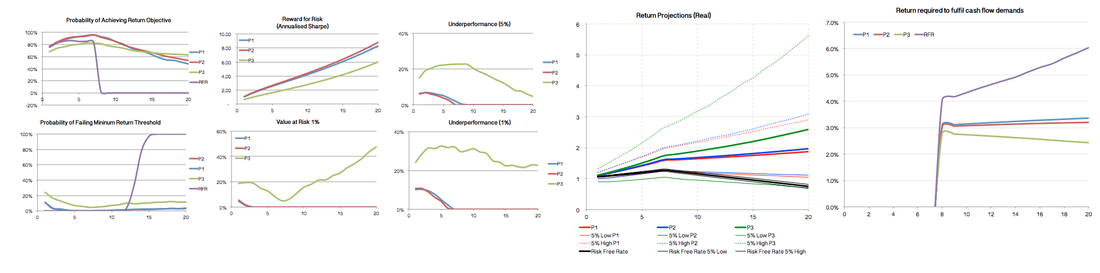
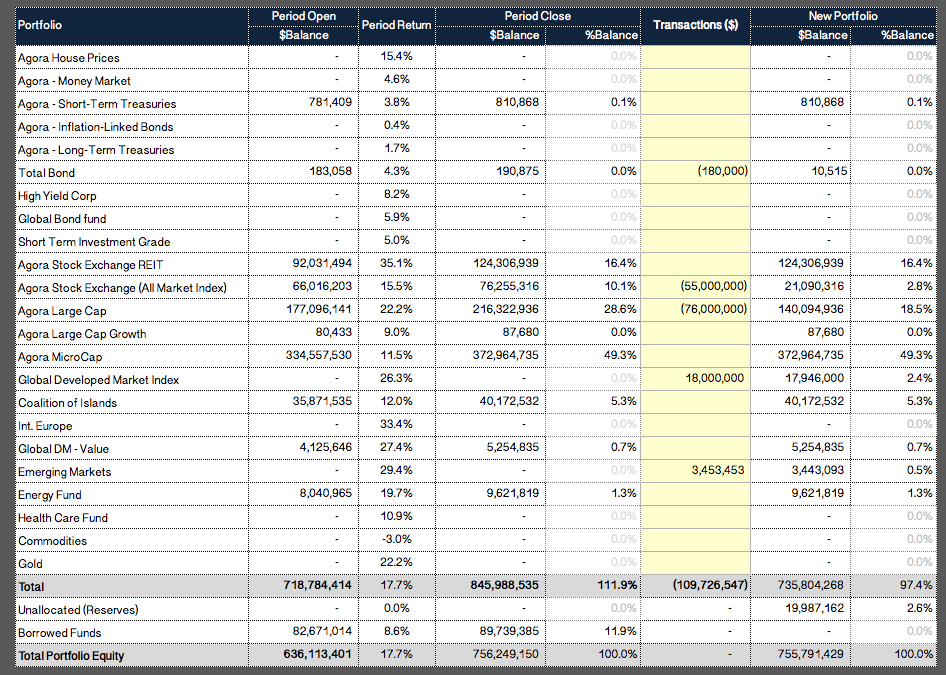
Monte Carlo Simulation - Portfolio modelling
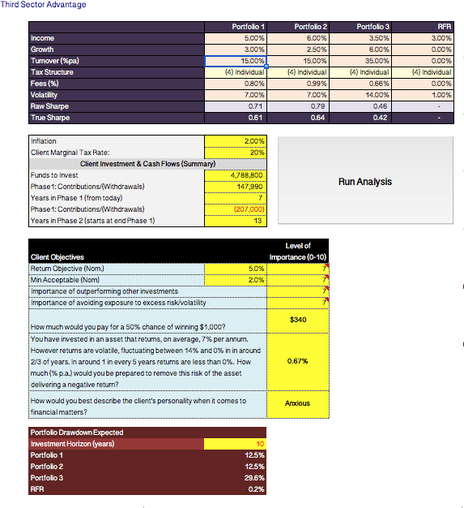
|
This Monte Carlo simulator provides a comparison of three portfolios (plus Risk Free Rate), with ability to incorporate the impact of tax, fees, composition of returns, portfolio turnover, return objectives and inflation. Simulations incorporate client cash flows (contributions/withdrawals).
Analysis includes the following:
We also incorporate several qualitative factors, such as the client's personality and the importance of reaching certain goals as a way to gauge a client's risk tolerance and, specifically, the influence of behavioural bias (eg: loss aversion, mental accounting, framing). |
|
Portfolio Optimisation (non Markowitz)
|
This was one of our first Portfolio Optimisation tools that incorporates valuation anomalies and asset cycle length to estimate the future return trajectory of assets. It uses a normal distribution to factor in mean reversion (in a manner consistent with Time Decay) and uses this to predict future returns.
Though the math behind this approach is solid, we have since moved to a model that accounts for Price Velocity and "fat tailed" distributions, such as Cauchy or Laplace, which we believe better reflect "real world" market behaviour. As with our other models that incorporate asset cycles and pricing anomalies, as time moves forward investment allocations will adjust to reduce risk at the short end of the portfolio, while responding to changes in the relative value of assets. This has the effect of reducing exposure to assets as they become overvalued, and increasing exposure as they become cheap. |
|
Retirement, Savings & Quality of Life
|
This calculator was build to help illustrate the effect that small changes to savings and expenses can have on their retirement, and in particular the "first phase" of retirement, which we describe as being the time between ones retirement and the point at which they become less active (normally from about 80 years of age).
We find it important to discuss this with our clients as focusing only on their finances may lead many to work longer than they want, and in doing so quickly erode the time they have to pursue their retirement goals such as travel, active family time and involvement in their local communities. For example, in the example to the right, this person's goal of retiring at 62 years of age is achievable, and from their current age and position results in about 37% of their future life being spent saving (working), 35% in active retirement (Phase 1), and 28% in the second phase of their retirement. If, however, they reduced their household expenses by about 6% they could change these proportions to 22%, 50% and 28%; a 40% increase in their active retirement years. |
|
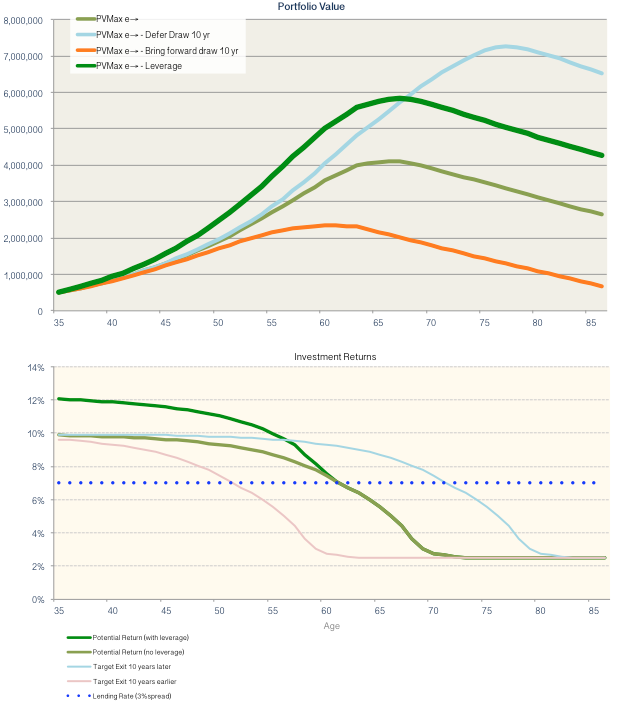
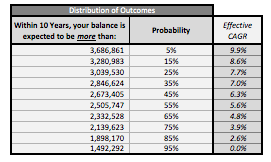
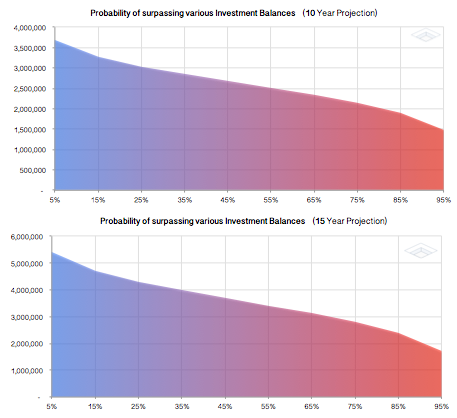
Volatility-adjusted returns: adjusting for time, cash flows and leverage

|
Our motivation behind this model was to help clients better understand the difference between volatility and risk, and to show that even for a risk-averse investor, the mean-reverting nature of most assets produces a non-linear distribution of outcomes that, over time, can present an excellent opportunity to enhance returns.
We also include examples showing the difference in outcomes if their "exit" (this was made for aspiring retirees) is brought forward or pushed-back 10 years. By educating our clients and quantifying the difference in prospective return and potential risk we find many investors become much more accepting of volatility and comfortable taking a long-term view of their investment journey. |
Economic & Market Analysis
|
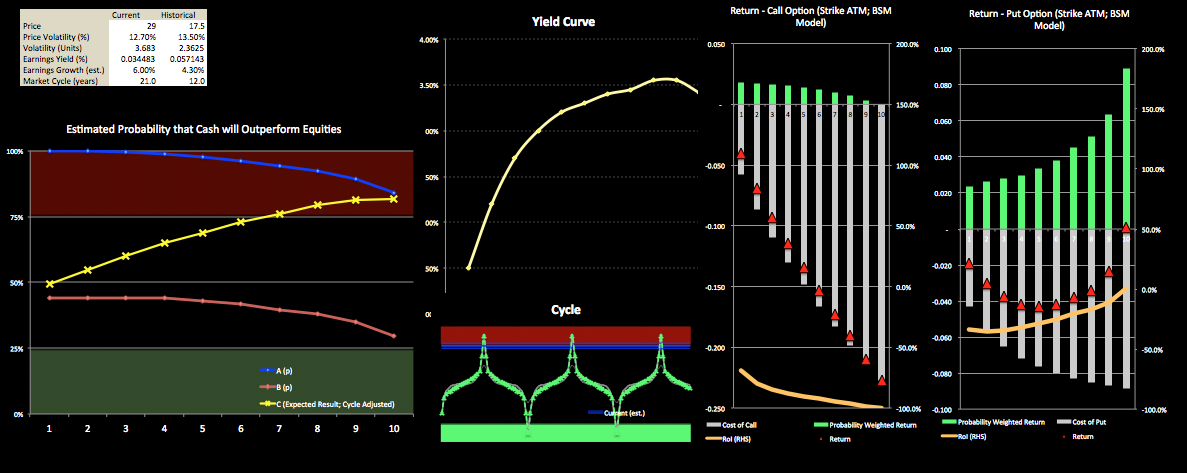
The Case for Cash
|
Consider a scenario where cash is yielding 1%, and equities, although looking incredibly expensive, are still offering a yield of about 5%. Your client is fairly risk averse, yet requires about 6% per annum to meet their objectives long-term. What do you do?
This model is designed to help answer this question. Here we compare the cash flows of an asset (such as equities, infrastructure) against a the yield curve of a risk-free benchmark. We then calculate how much our risky asset's price must fall to eliminate the return advantage, and convert this into a probability based on the asset's valuation relative to fair value, and the cycle length of that asset. Therefore, this model does not tell us by how much an asset might under or out-perform, but rather the probability it will happen. We also include a snapshot of the return profile from both Put and Call ATM options (BSM). This is particularly useful for investors that might have large unrealised capital gains and highly variable tax rates who might wish to defer the sale of assets. In this case investing in Put options might provide a more cost-effective and efficient way to reduce risk than selling the asset outright. |
|
Schiller CAPE Analysis (R, Shiny)
|
An interactive dashboard illustrating the distribution of the Cyclically Adjusted Price-Earnings Ratio (Case-Shiller PE, or CAPE).
This application was built using R (code), with graphics interface loaded through Shiny App. Data sourced from Professor Shiller (Yale University), with CSV files uploaded from Quandl. Current to July 2017. |
|
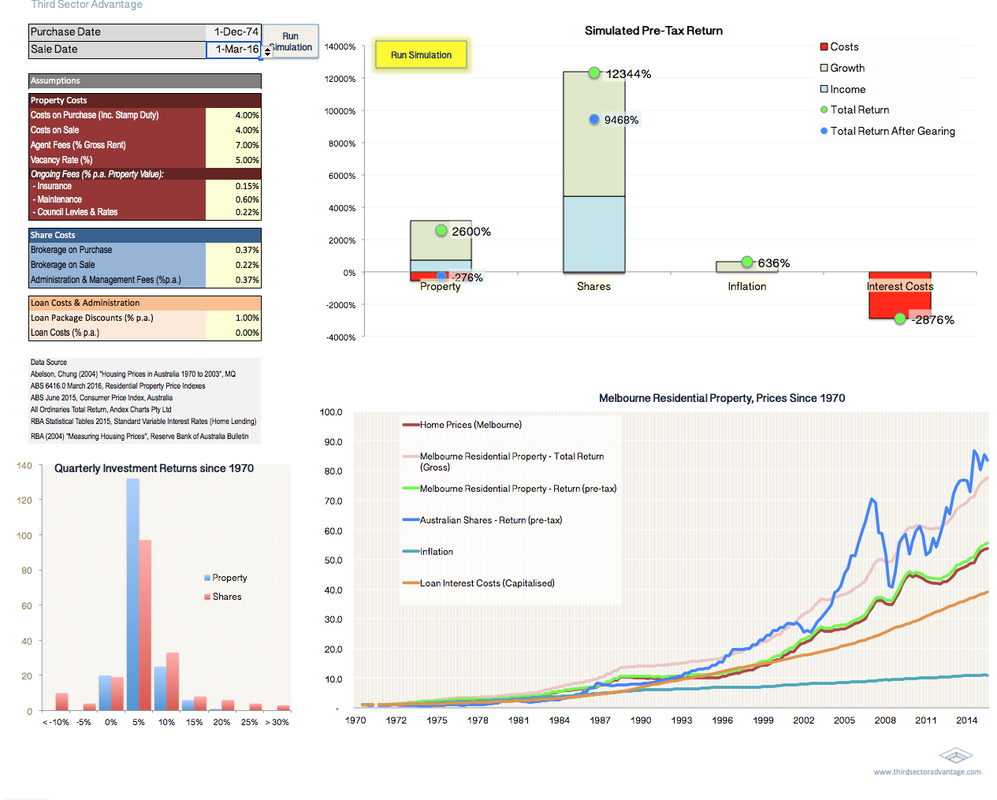
Property vs Shares (Simulator)
|
Roughly 40% of Australian's private wealth is tied up in residential property, and of that the majority is invested in the family home. Most people I have come across over the past 15 years profess to know a lot about property investment, if not from first-hand experience, from television, radio, books or anecdotes from family or friends.
Despite this confidence, in my experience very few advisers, and even fewer investors, have a proper understanding of the economics or investment characteristics of property. This simulator was constructed to help clients and advisers alike to gain a better understanding of the history and return characteristics of residential property investment in Australia. A more detailed discussion is covered in our IWS Residential Property Review (revised and published every 2 - 3 years). |
Other
|
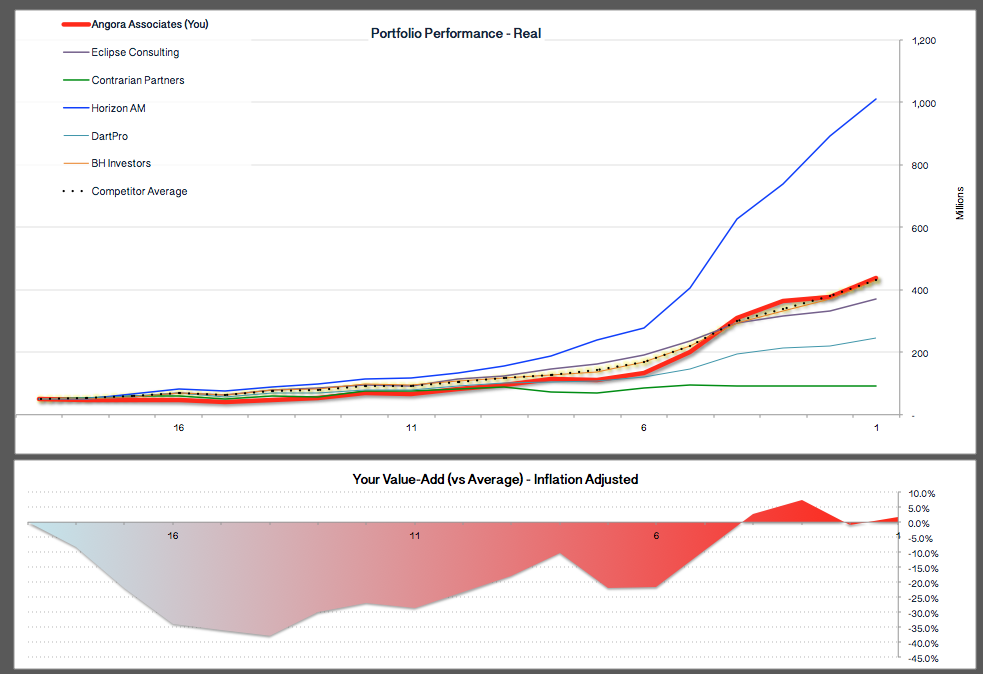
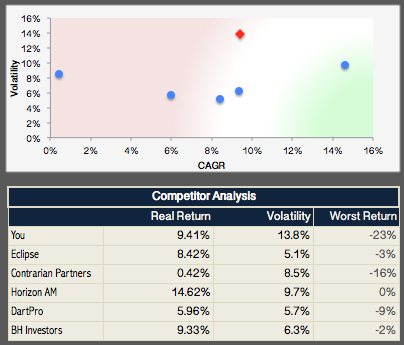
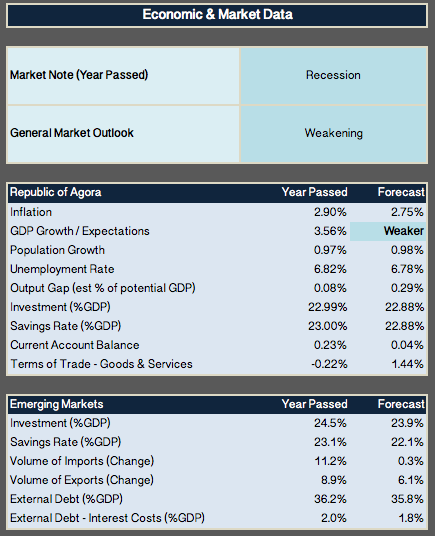
4Sight (trading simulator)
|
4Sight is a trading simulator designed to help advisers test, learn from, and improve their investment decision-making processes.
This simulator uses an algorithm to convert real-world (non-parametric) returns and incorporate exogenous variables, such as political, economic and market events. Importantly, while the data driving the simulator is real, to encourage investors to look at the data supporting their investment decisions, the names of countries have been changed. Investment costs are also included, as are alternative assets such as residential real estate and commodities. To test the investor's skill level, 4Sight also pits the investor against other investors, each of which is programmed to implement their own unique investment style. Background The ideas behind 4Sight not only come from observing the behaviour of investors (and investment advisers) but also from the growing body of research into neurofinance which finds that investors' decision-making process and abilities are often influenced by the body's physiological responses to stimuli (in particular the cognitive response to fluctuations in testosterone and cortisol). Learning to compensate for, if not control, one's biases (emotional, cognitive and chemical) sets the framework for a more rational, robust and consistent approach to investment and risk management. In Development: 4Sight+ 4Sight+ will allow the user to run their portfolio (in the simulation environment) as a professional investment fund. This includes modeling fund flows based on both relative and absolute performance (after-fees), as well as business and staff costs. The idea to include these features comes from the observation that many investors are willing to underperform, and pay higher fees, so long as returns were not negative, while many investors feel compelled to withdraw from financial investments or managers if their performance is negative, even returns were better than their peers. |
|
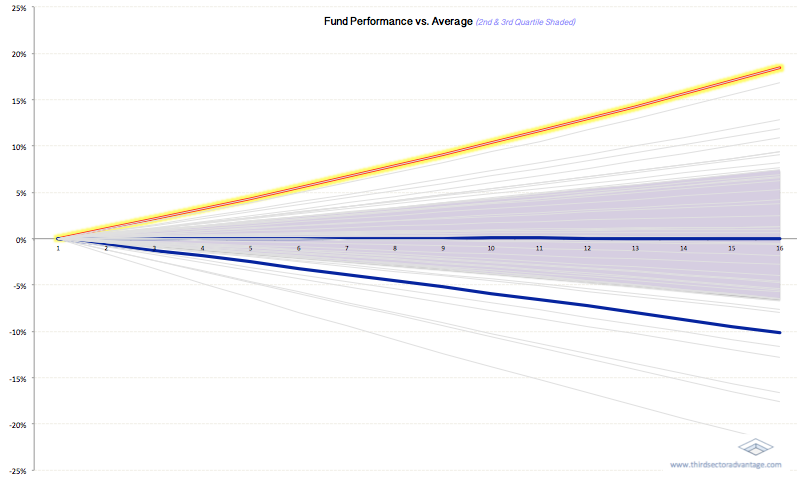
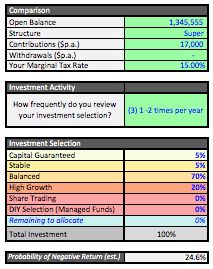
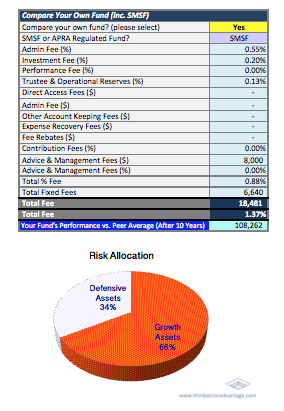
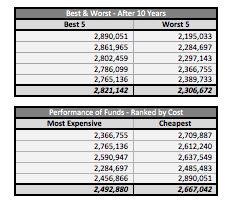
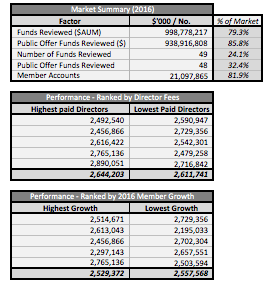
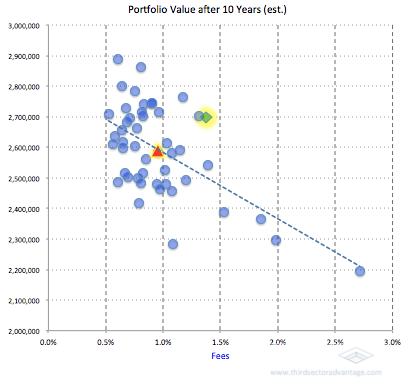
Superannuation Fund Review (2017)
|
Choosing a superannuation fund can be a daunting task. This calculator was prepared to help simplify the process.
Here we compare Australia's largest 49 public offer funds which together represent over 21 million individual accounts, with a total value of approximately $1 trillion, or 79% of the total assets managed by APRA regulated funds. In addition to analysing fund performance and fees, our analysis considers client cash flow (contributions and withdrawals), investment strategy, taxation, and member engagement in order to identify the funds most likely to meet their requirements. |
|
Investing in Small Business: Analysis of cash flow and capital structure
|
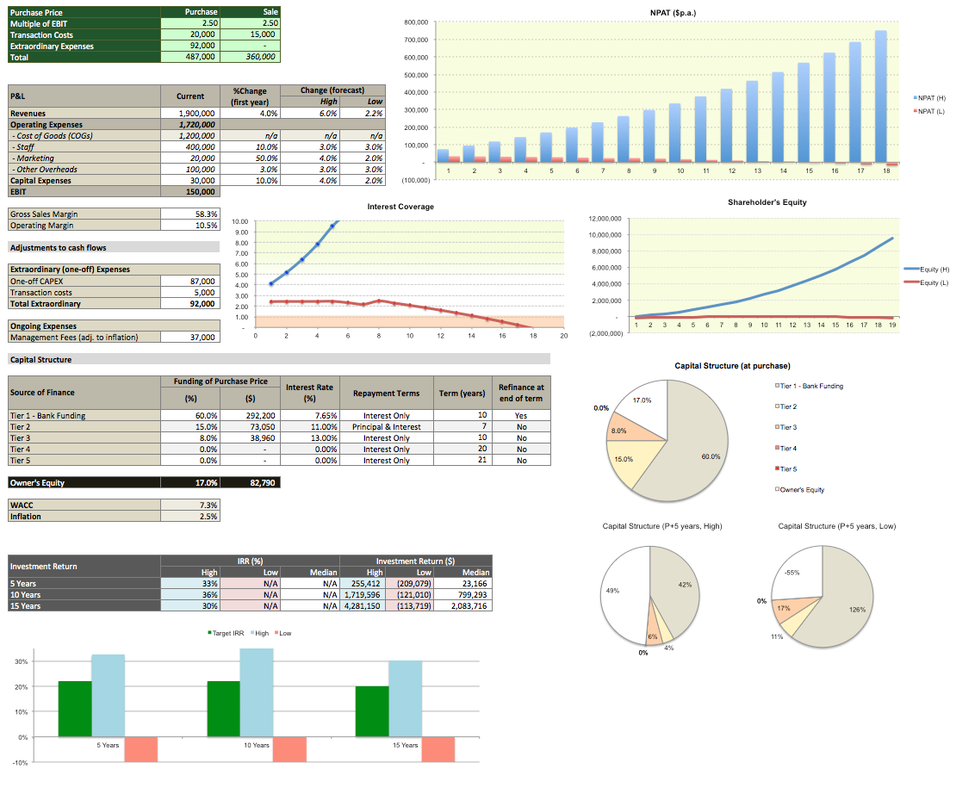
A simple to use calculator illustrating the effect of leverage, risk, and changes in the P&L on shareholder wealth.
This spreadsheet isn't designed to replace a business plan; rather it is designed to be used as a "sanity check" for prospective purchasers to quickly and easily see the effect of different funding structures and changes in business performance measures. This model contains a number of particularly useful features. For example, we provide the ability to model a two scenarios ("High" and "Low"). This is to encourage prospective investors to think about what might happen if business conditions deteriorate. We also include options to adjust earnings for both extraordinary and recurring items. An example here might be an allowance for a "Management Fee" by the new owner, or a large capital expense to launch a new product line or service. Example The example to the left is for a suburban tyre fitting franchise. The purchase was to be funded 60% bank, 23% from private funding sources (including seller debt), and 17% ($83,000) by the investor. Included in this purchase price is $92,000 to purchase a new vehicle and equipment customised to provide a "mobile tyre fitting" service. We have also allowed for a very aggressive marketing strategy, with a 50% increase in marketing allowance in year one, plus a substantial pay rise for existing staff; our objective here is to ensure key staff are retained, and to attract high performers from local competitors. Although he is not intending to be involved in the day-to-day operation of the business, the investor has also included Management Fees of $37,000 per annum. From this we see that if the business meets it's revenue targets, the investor's 10-year IRR is approximately 36% p.a., or a return of about $1.7 million on his $83,000 investment (this is in addition to Management Fees received). We also see that our low-range estimates result in a 10-year loss of about $121,000 (representing his $83,000 investment, and cash losses of about $38,000). Armed with this information, the investor may reconsider his growth strategy and capital structure. |
|
Life Expectancy Calculator
|
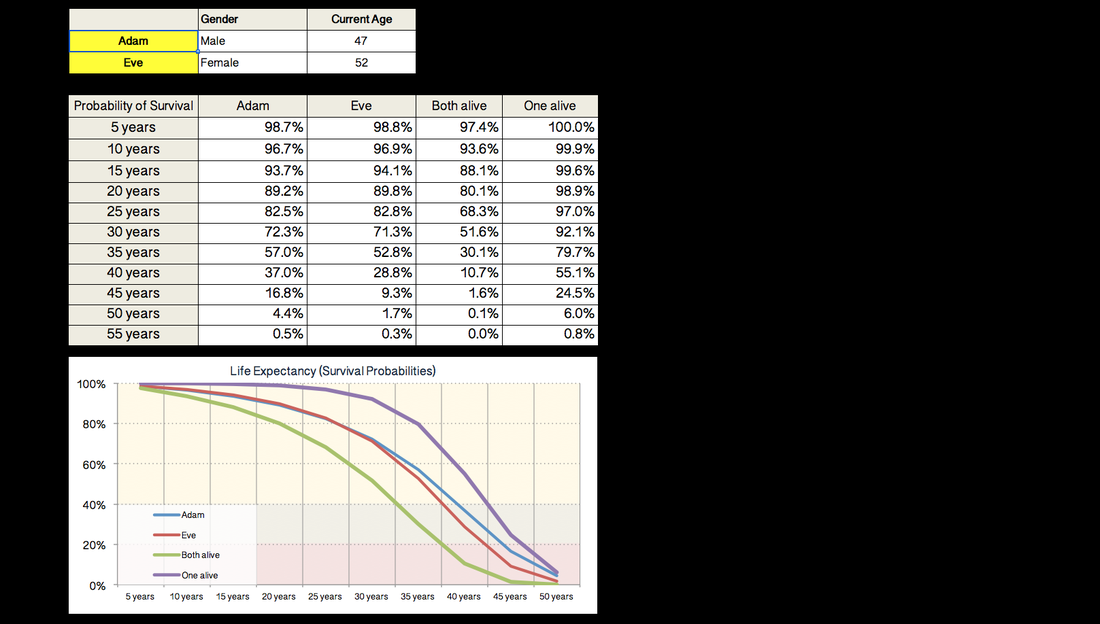
Based on Australian Life Tables (2014), this simple life expectancy calculator is designed to help with client discussions around issues such as capital adequacy and the risks of outliving their retirement savings.
|
|
Income Tax Calculator
|
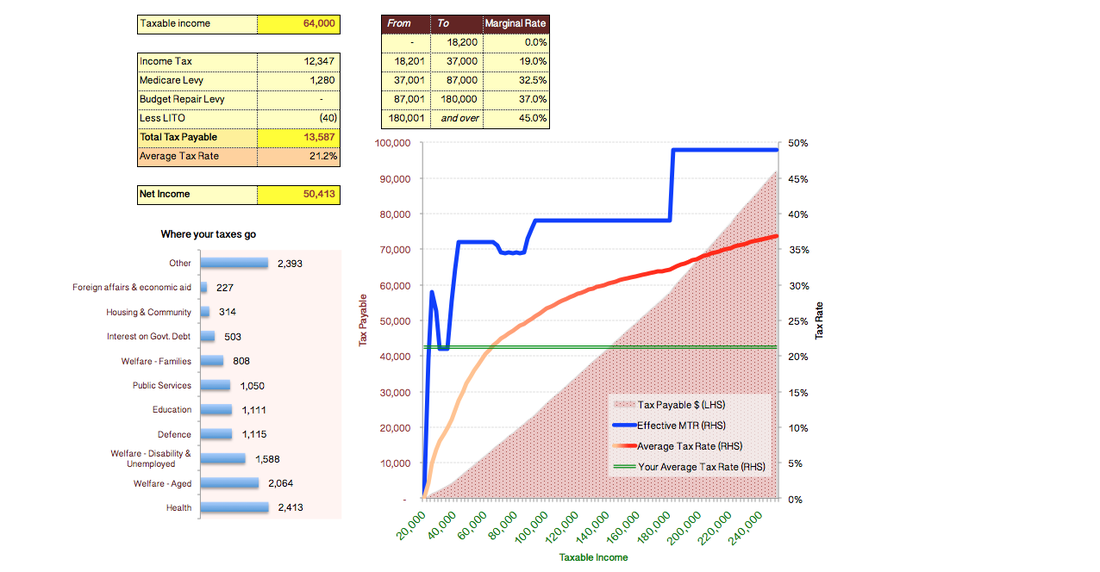
A quick and easy Income Tax calculator (based on tax rates announced in the 2016 Federal Budget).
|